imx motor tests
fully automated standard
for testing electric motors
From starting a test to the test report
with one click
Our tests generate the insights you need as a developer and quality manager to assess electric motors. They are the basis for in-depth, well-founded knowledge of the test object and allow you to make conclusions about the quality and motor parameters.
Our approximately 15 different standard test types have a modular design and can also be integrated into a test bench later on. They are also continuously maintained and improved (Information on the November 2023 update can be found here).
The imx standard test types for electric motor tests basically consist of an automated test sequence and measurement data evaluation.
During a test, for example, different load profiles or load points of an electric motor are applied. The speeds, torques etc. to be achieved can be parameterised so that electric motors with different voltage levels and speed/torque ranges can be tested with one test type. Parameterisation is done via the configurator of our imx OMEGA test bench software . The raw data is recorded during the test and then analysed automatically.
The evaluation can also be parameterised, for example various PDF templates can be created and selected and load points of particular interest can be defined and evaluated. The evaluation can be executed automatically following a test run or manually in a separate program. The results are recorded in a PDF report or can optionally be saved in a database or in alternative data formats.
For a better overview, the test types can be divided into the following categories.
No load tests
These are tests that are performed without a loading unit.Passive tests
These are tests in which the DUT is not supplied with current.
Active tests
These are tests in which the DUT is supplied with current or commutated.
Custom tests
In addition to the test types described above, there are a large number of test types that are defined on a customer-specific basis and reflect the specifics of the DUT’s area of application.
No load tests
The test types that can be performed without a load unit are called no load test types.
Since the 1990s, imx has been working on the loadless measurement of electric motors. Now essential especially in the area of end-of-line (EoL) testing, parameter identification (PI), i.e. the loadless determination of all essential motor parameters, is finding more and more access in the area of development.
The advantage: the loadless methods usually need a few seconds to completely measure motors. Motor heating/cooling, expensive load machines/power trains and torque sensors are no longer required.
Loadless test types include:
imx Parameter Identification (PI) EC
The imx Parameter Identification EC is a turnkey model-based method that determines the parameters characterizing a permanently magnet synchronous motor.
Description of the test procedure
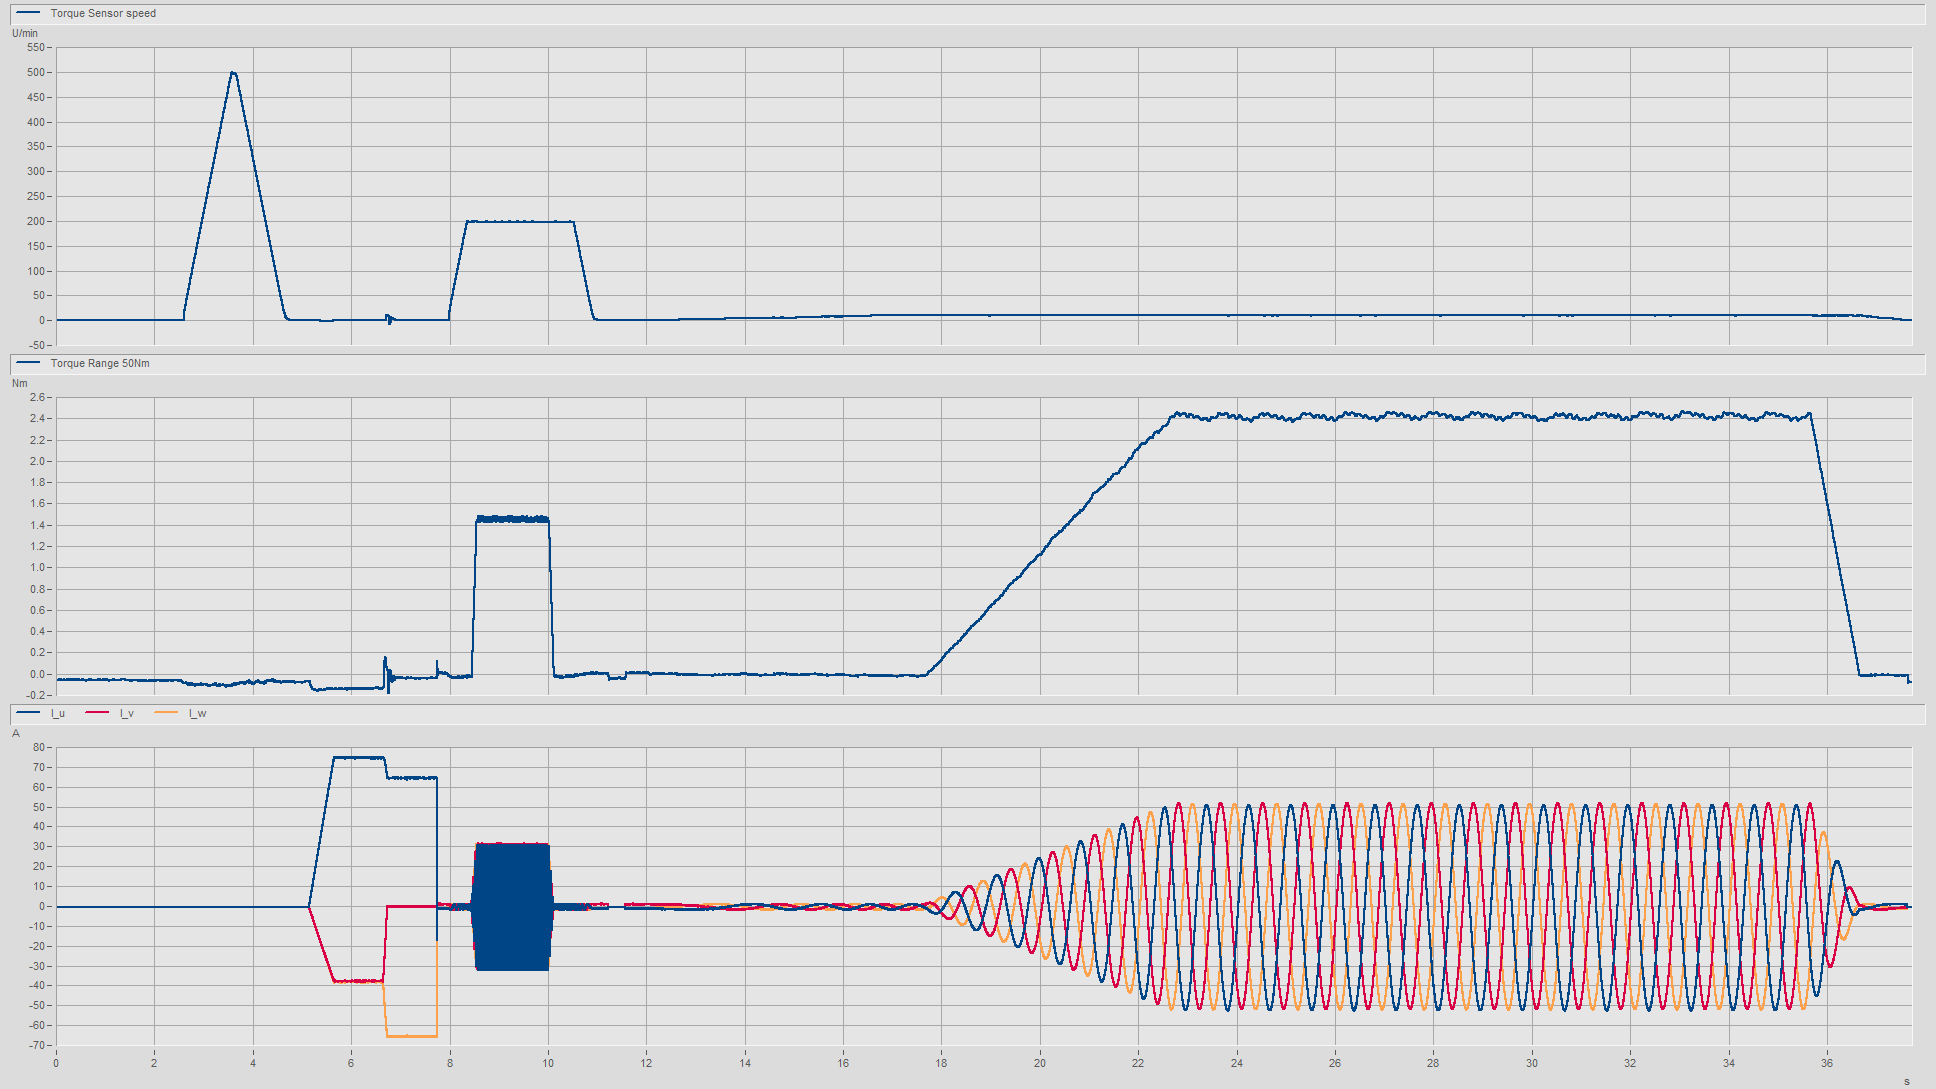
Depending on the design of the test mechanics, the DUT is placed in the test fixture and contacted. After closing the safety enclosure, the motor is supplied with current or decelerated, so that there is a dynamic change in speed. During the process, the limits of the DUT are monitored so that no overloading of the DUT occurs. After the test is completed, the primary parameters and the derived parameters of the DUT are calculated. The test specimen is then released so that removal or extraction of the test specimen is possible.
Primary results of the test type
- Strangwiderstand
- Electrical excitation
- Inductance
- Dynamic friction
- Static friction
- Inertia
Examples of derived results of the test type
- No load speed
- No load current
- Start-up current
- Start-up torque
- Electrical time constant
- Mechanical time constant
- Speed constant
- Torque constant
Flux table EC dynamic
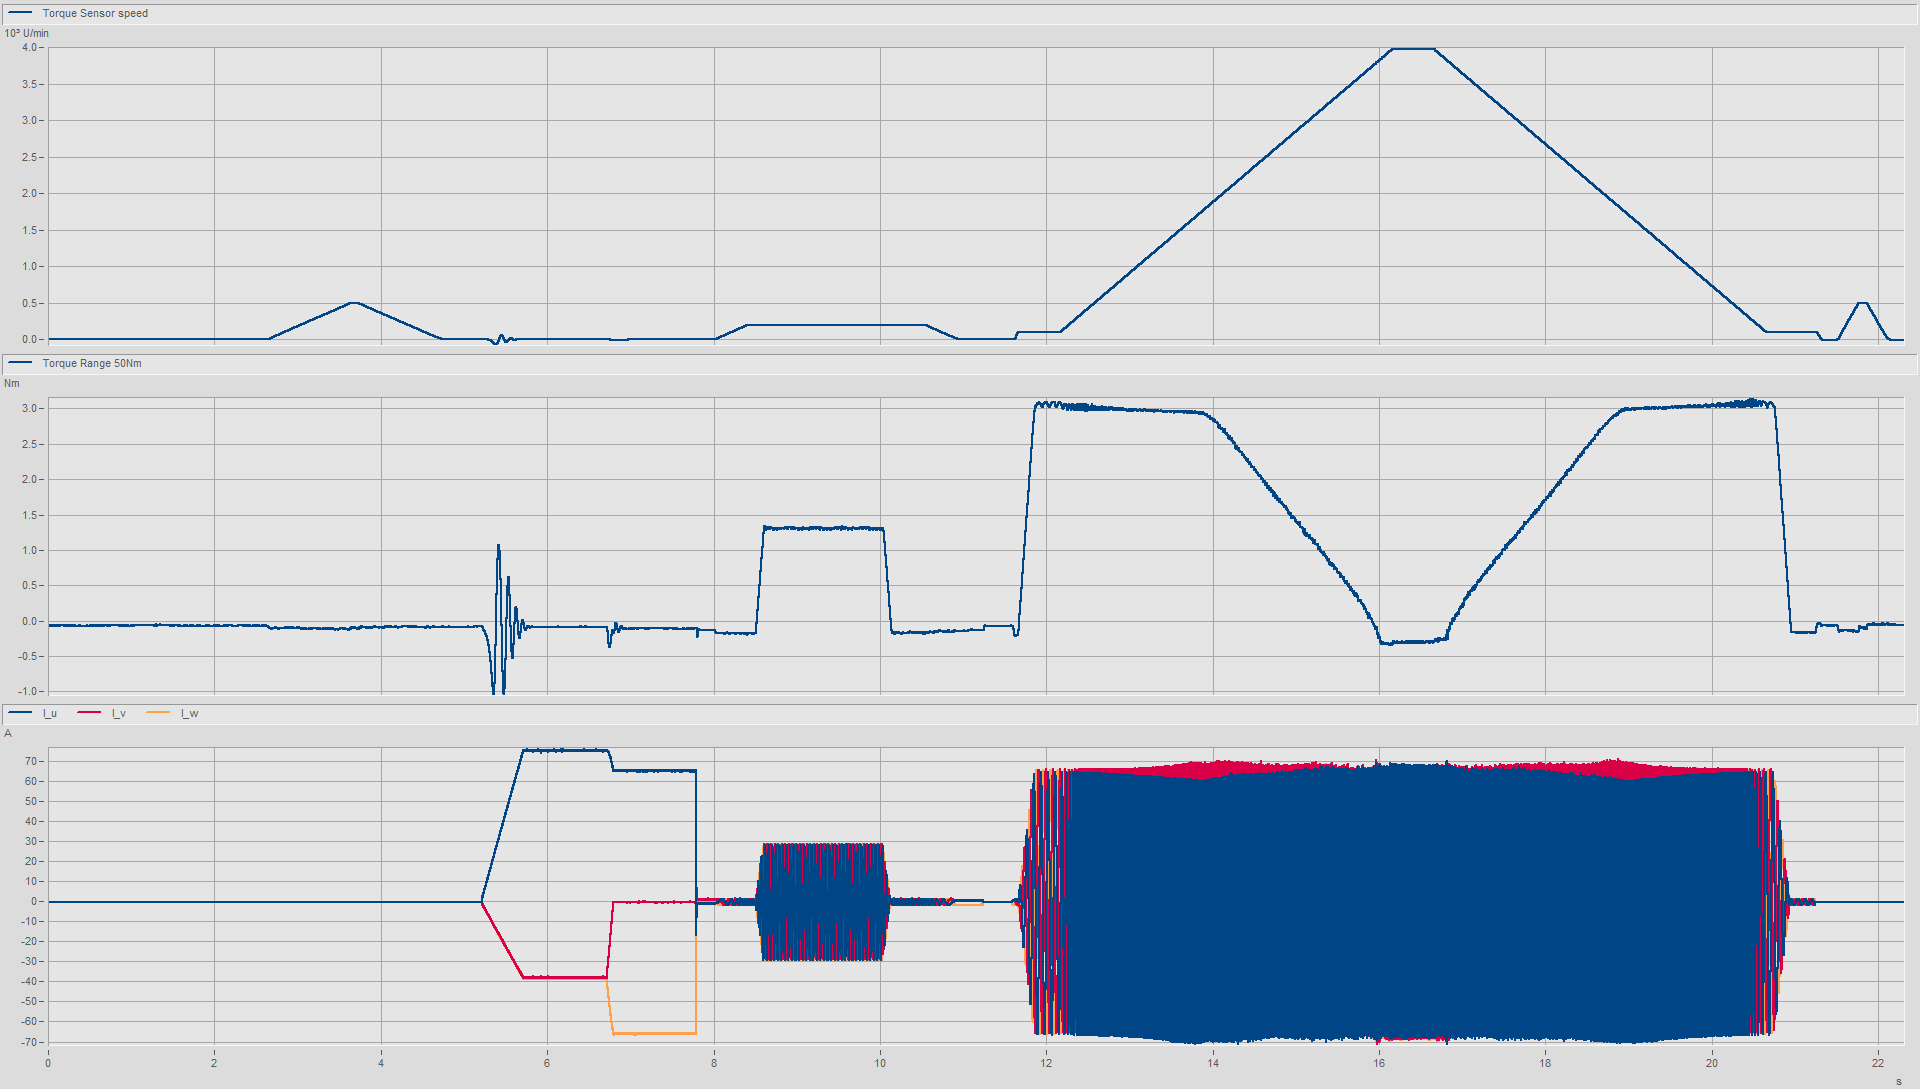
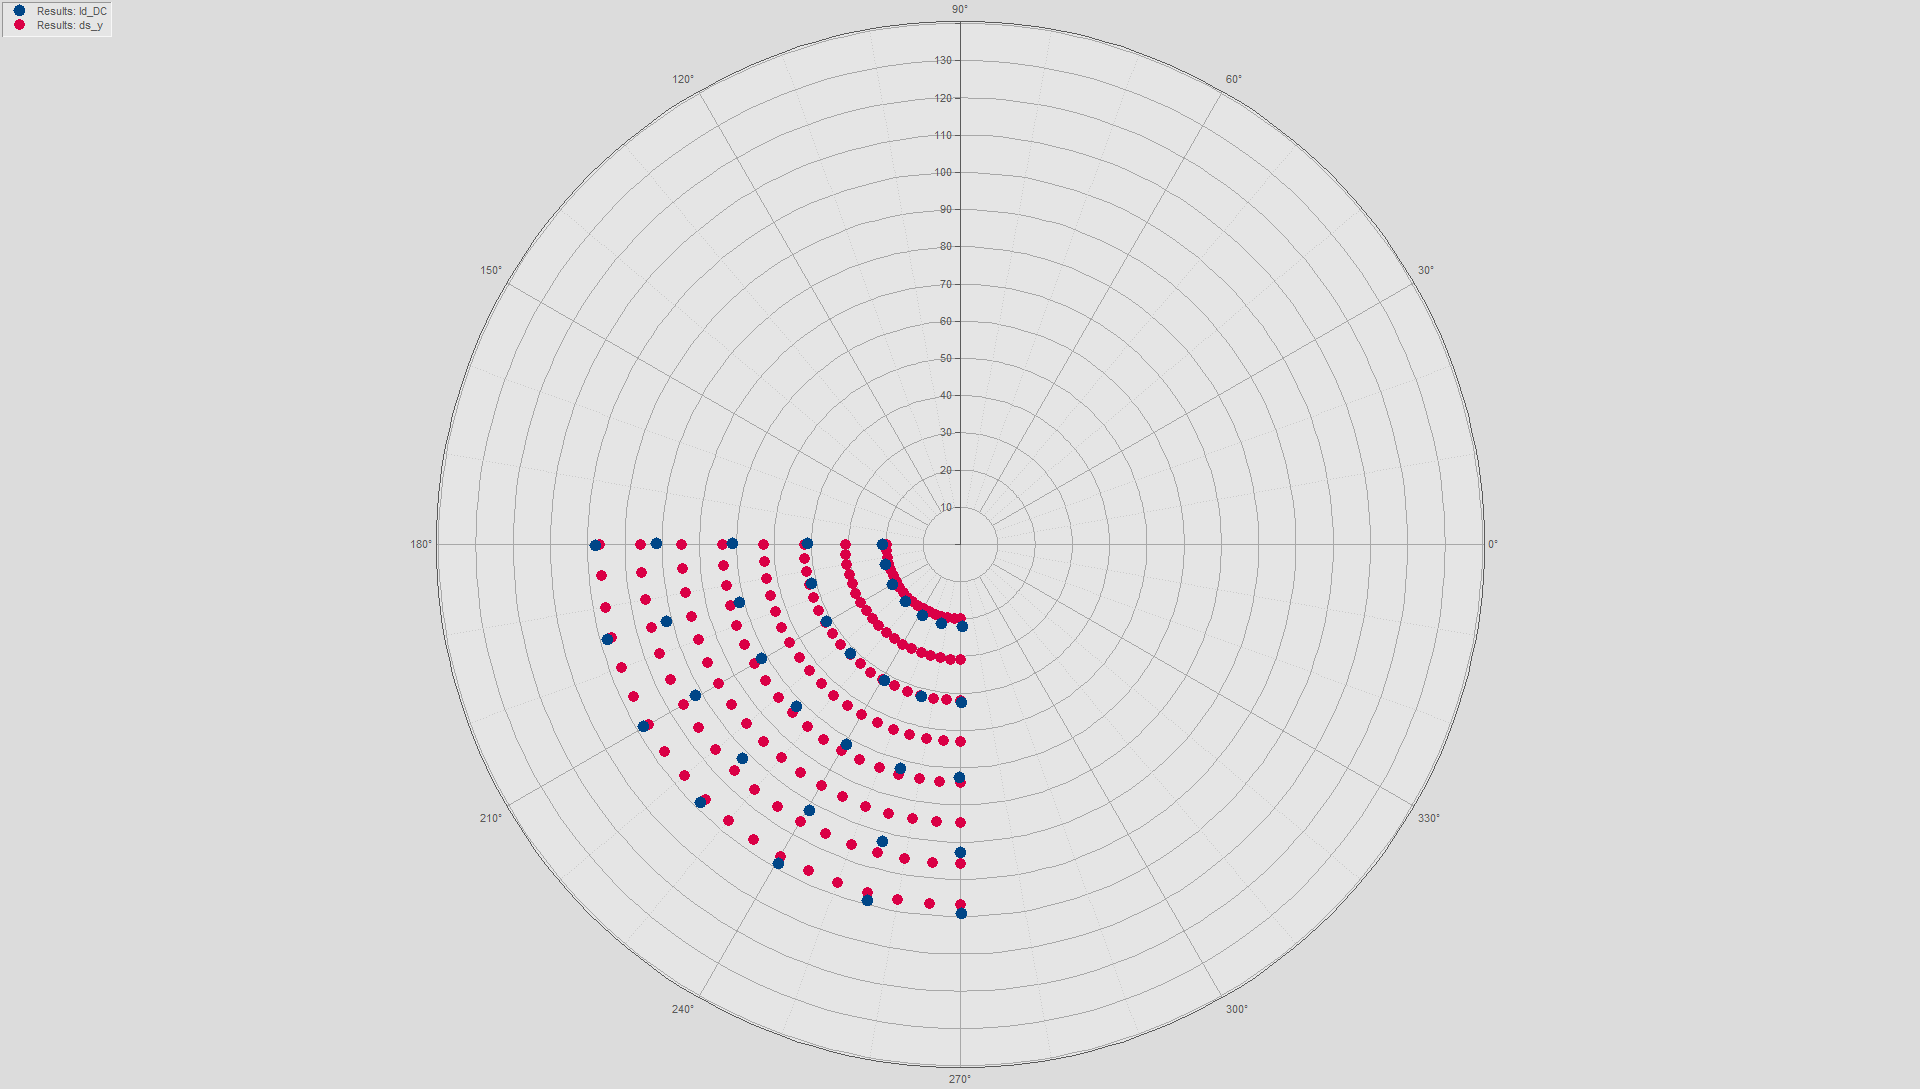
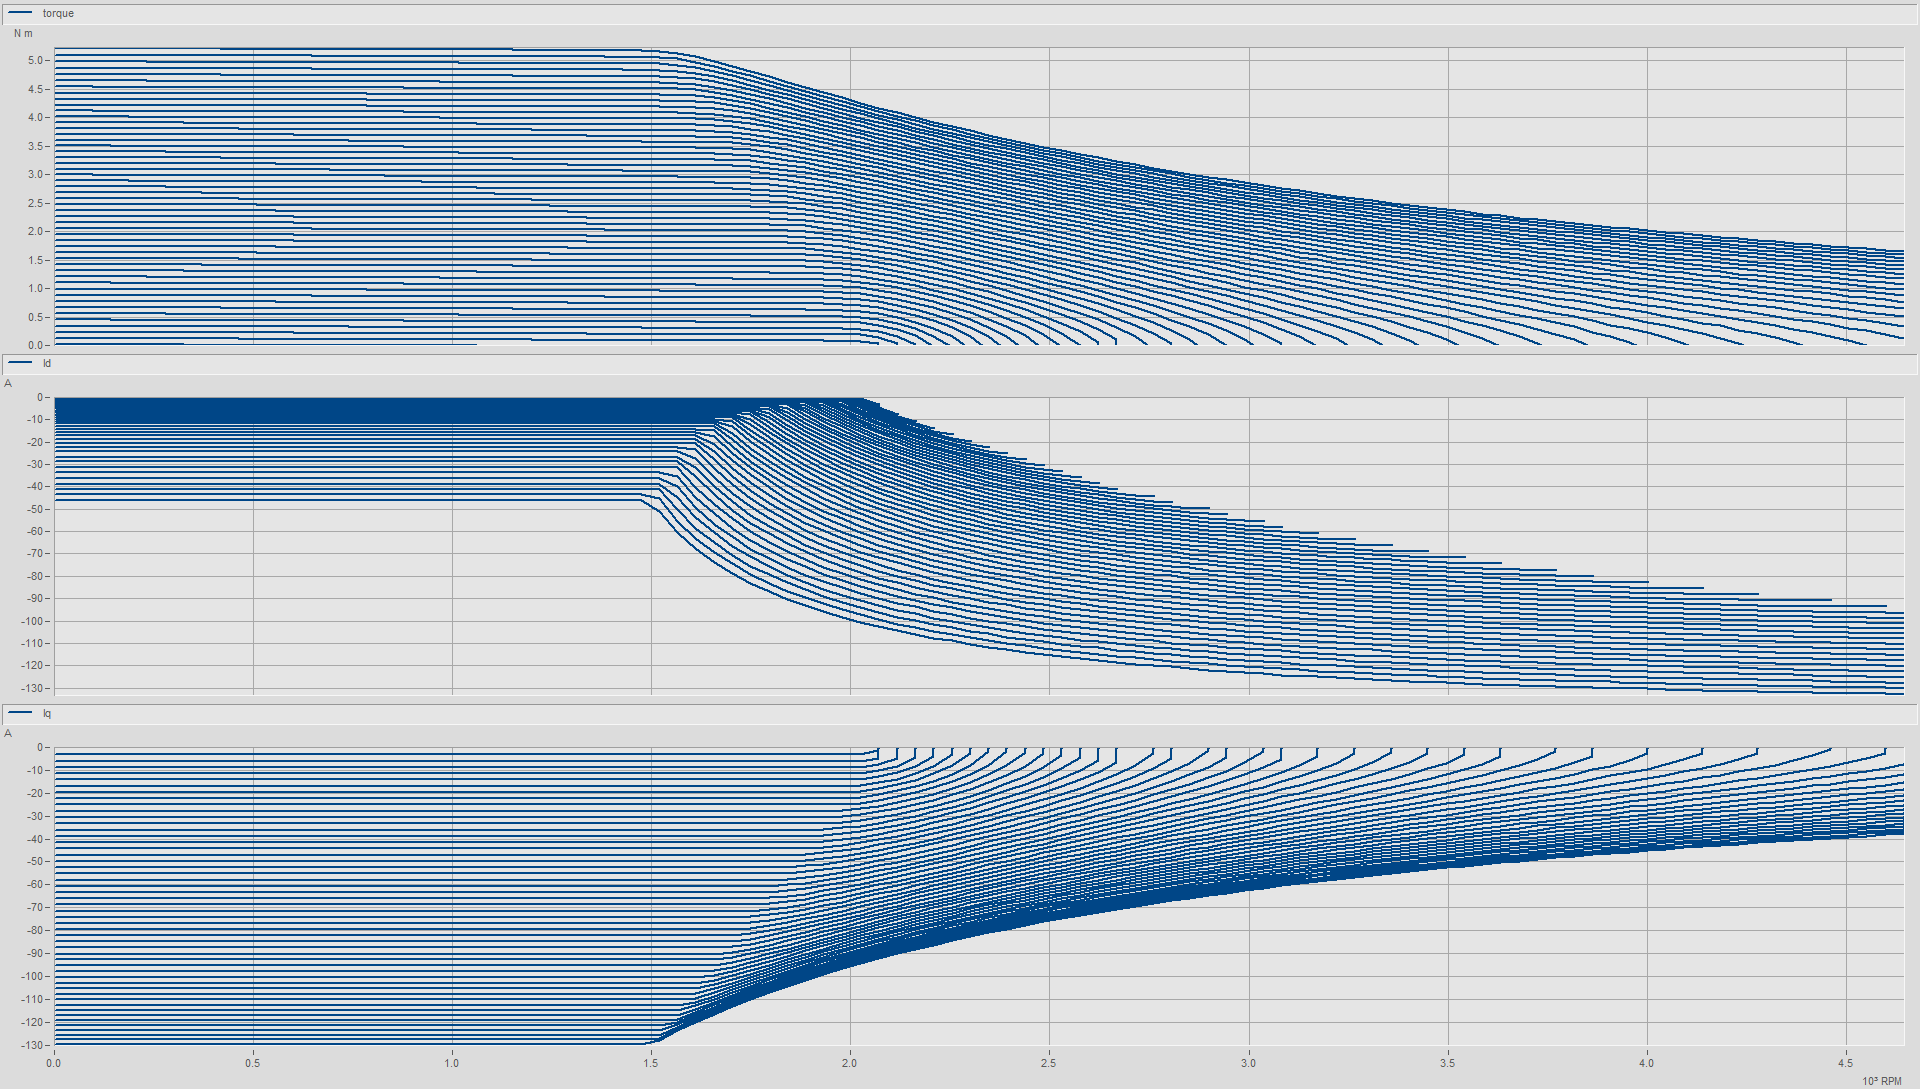
The dynamic flux table measurement determines the magnetic flux in the d and q directions as a function of the total current. For this purpose, the DUT is dynamically loaded and the resulting load points are measured. In addition, the resistive losses as well as the friction and iron losses of the test specimen are determined.
Description of the test procedure
For dynamic flux table measurement, the DUT is connected to a controller. At the beginning of the test, the winding resistances of the DUT are determined in a DC current test. The DUT is then accelerated to the test speed and dynamically accelerated and decelerated by various current settings in the d and q directions. For each individual current step, the current angle is also varied step by step.
At the end of the test, the frictional torque is measured again in a downward ramp and the winding resistances are determined in a DC test. This measurement data is used both to compensate for the influence of the inertia in the speed ramps and to record the heating of the windings during the test.
Examples of derived results of the test type
- Magnetic flux in d-direction as a function of d- and q-current
- Magnetic flux in q-direction as a function of d- and q-current
- Internal electrical torque
- Maximum torque for the given current and voltage limits as a function of speed
- d-current as a function of speed to generate the optimum torque characteristic curve
- q-current as a function of speed to generate the optimum torque characteristic curve
- d-current as a function of speed and torque for the minimum total current at the operating point
- q-current as a function of speed and torque for the minimum total current at the operating point
- Total current as a function of speed and torque at minimum total current at operating point
- Electrically absorbed power as a function of speed and torque at minimum total current at the operating point
- Mechanical power output as a function of speed and torque at minimum total current at operating point
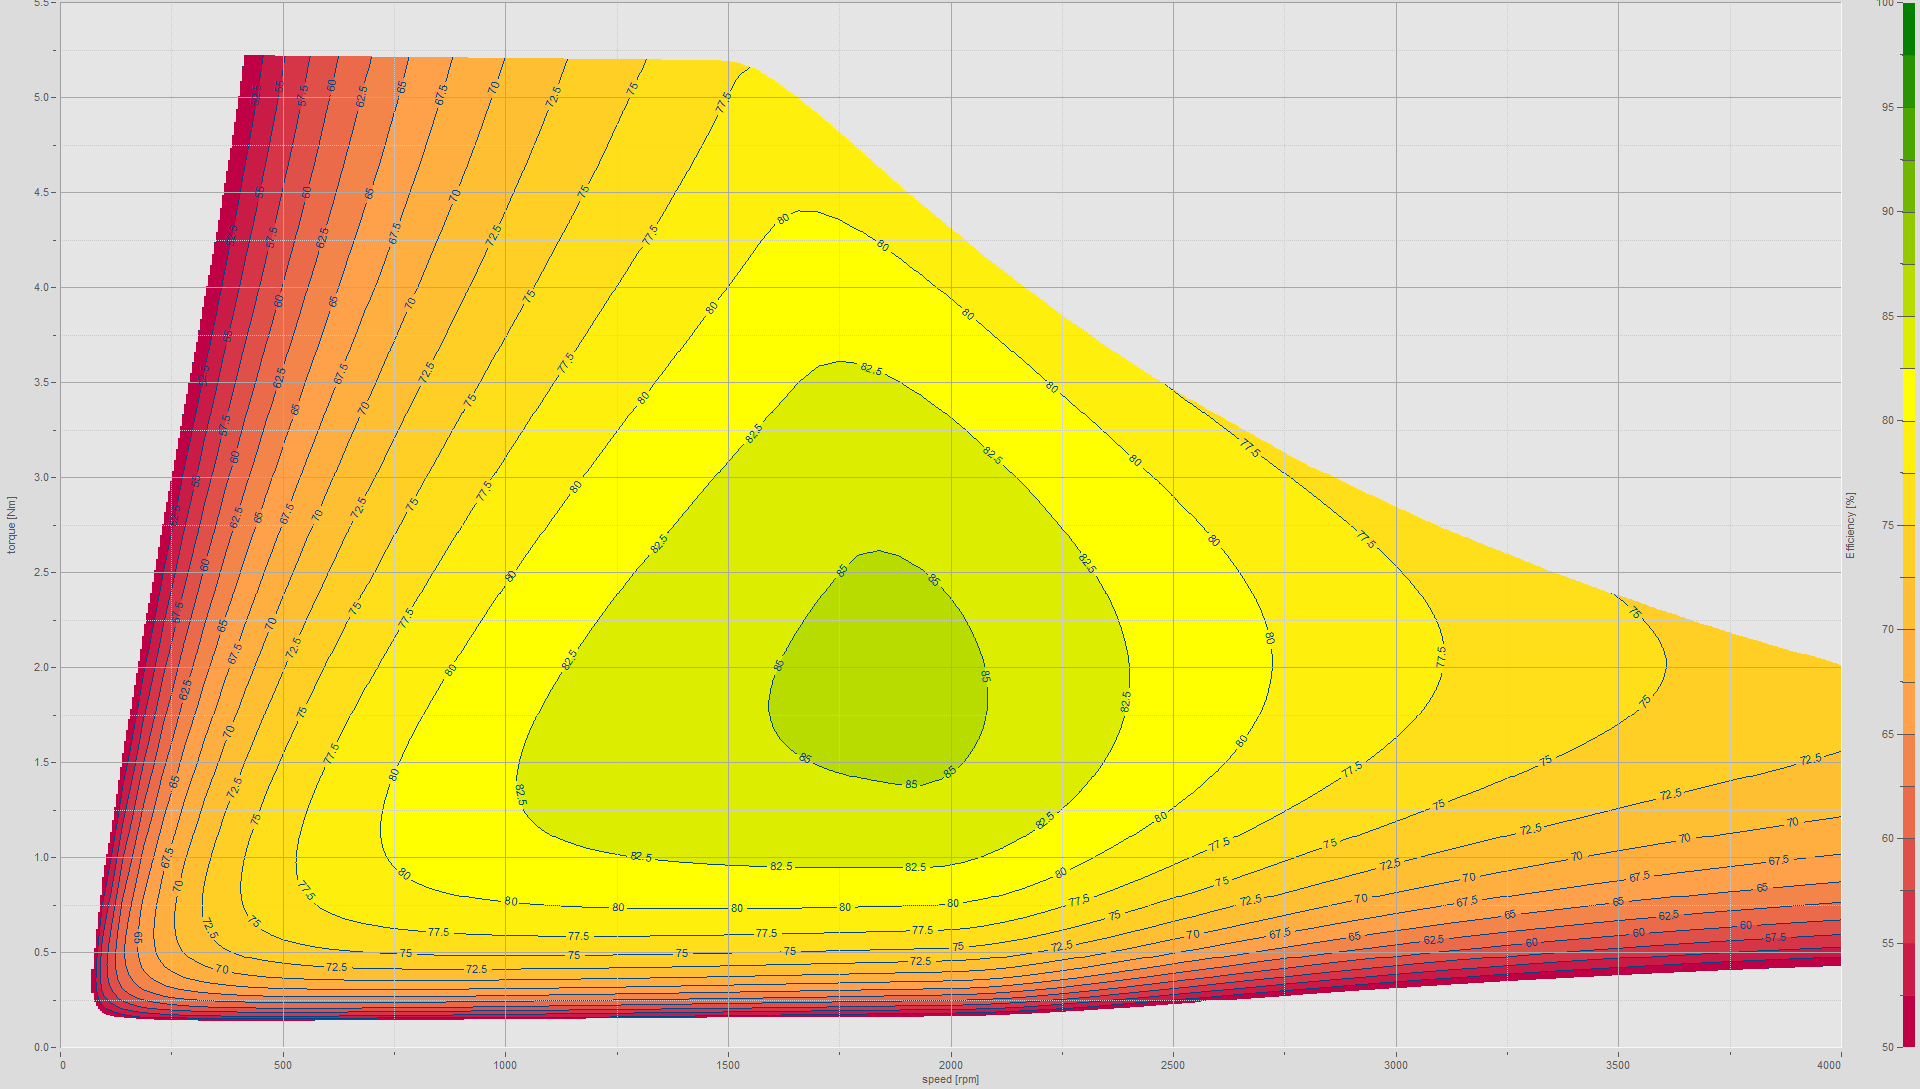
- Efficiency as a function of speed and torque with minimum total current at the operating point
- Ohmic losses as a function of speed and torque with minimum total current at the operating point
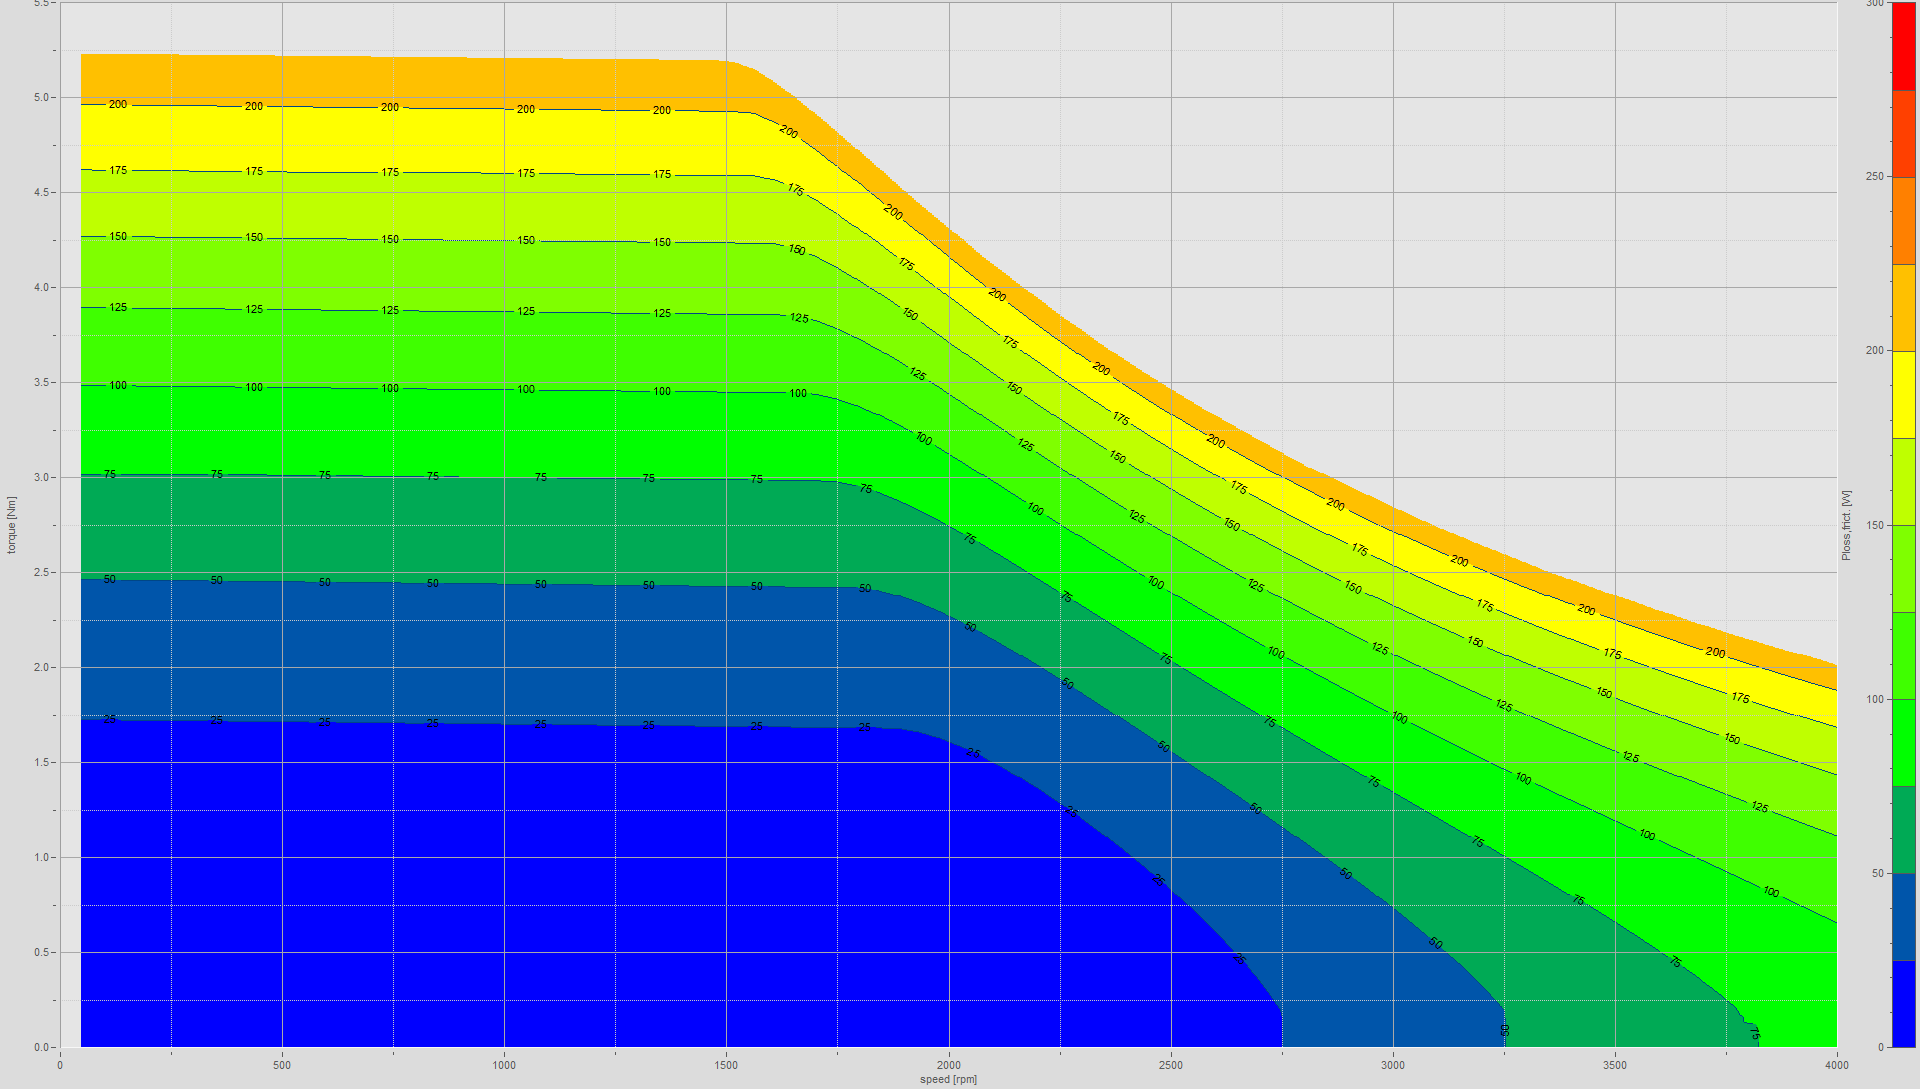
- Friction losses as a function of speed and torque
- Total losses as a function of speed and torque with minimum total current at the operating point
imx Parameter Identification DC
The imx Parameter Identification DC is a turnkey model-based procedure that determines the parameters that characterize a brushed DC electric motor.
Description of the test procedure
Depending on the design of the test mechanics, the DUT is placed in the test fixture and contacted. After closing the safety enclosure, the motor is supplied with current or decelerated, so that there is a dynamic change in speed. During the process, the limits of the DUT are monitored so that no overloading of the DUT occurs. After the test is completed, the primary parameters and the derived parameters of the DUT are calculated. The test specimen is then released so that removal or extraction of the test specimen is possible.
Primary results of the test type
- Terminal resistance
- Generator constant
- Inductance
- Dynamic friction
- Static friction
- Inertia
Examples of derived results of the test type
- No load speed
- No load current
- Start-up current
- Start-up torque
- Electrical time constant
- Mechanical time constant
- Speed constant
- Torque constant
Passive tests
Test types in which the DUT is mechanically connected to a load machine and is not itself supplied with current are referred to as passive test types.
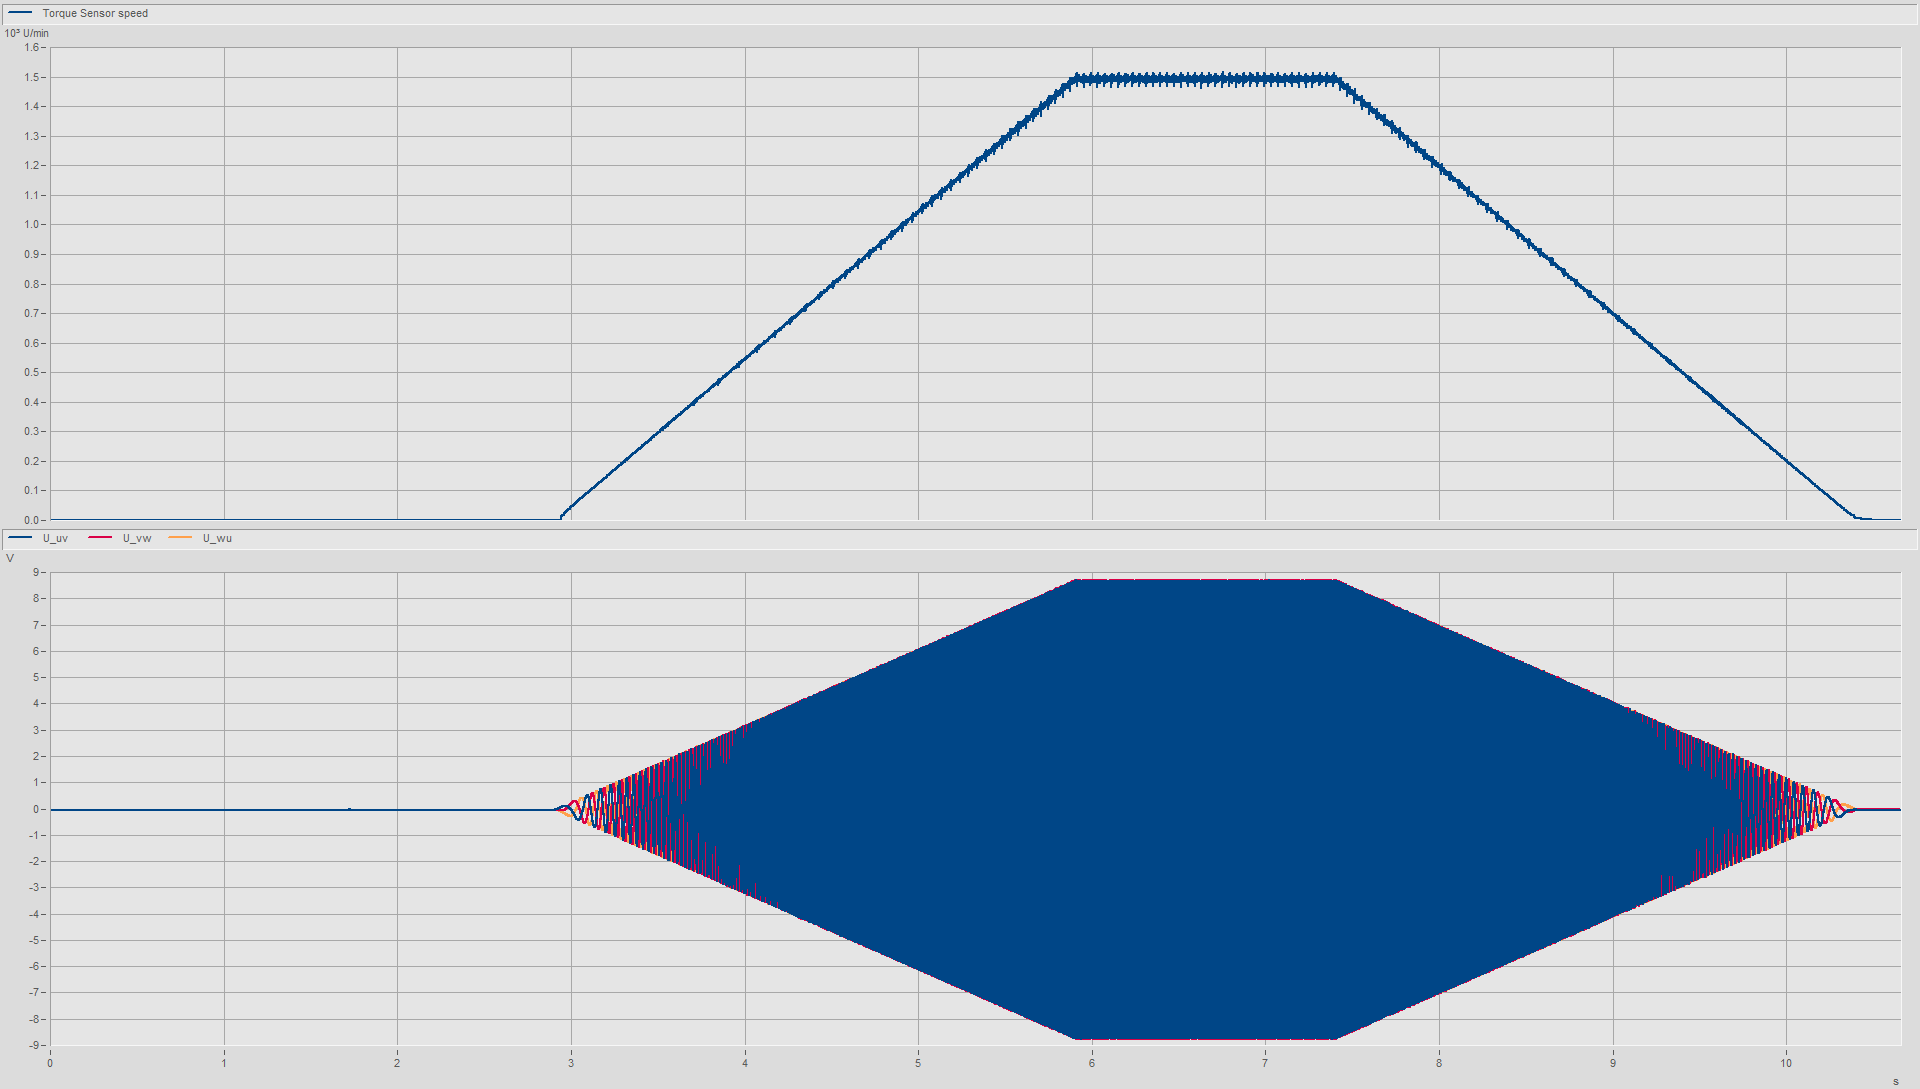
Back EMF
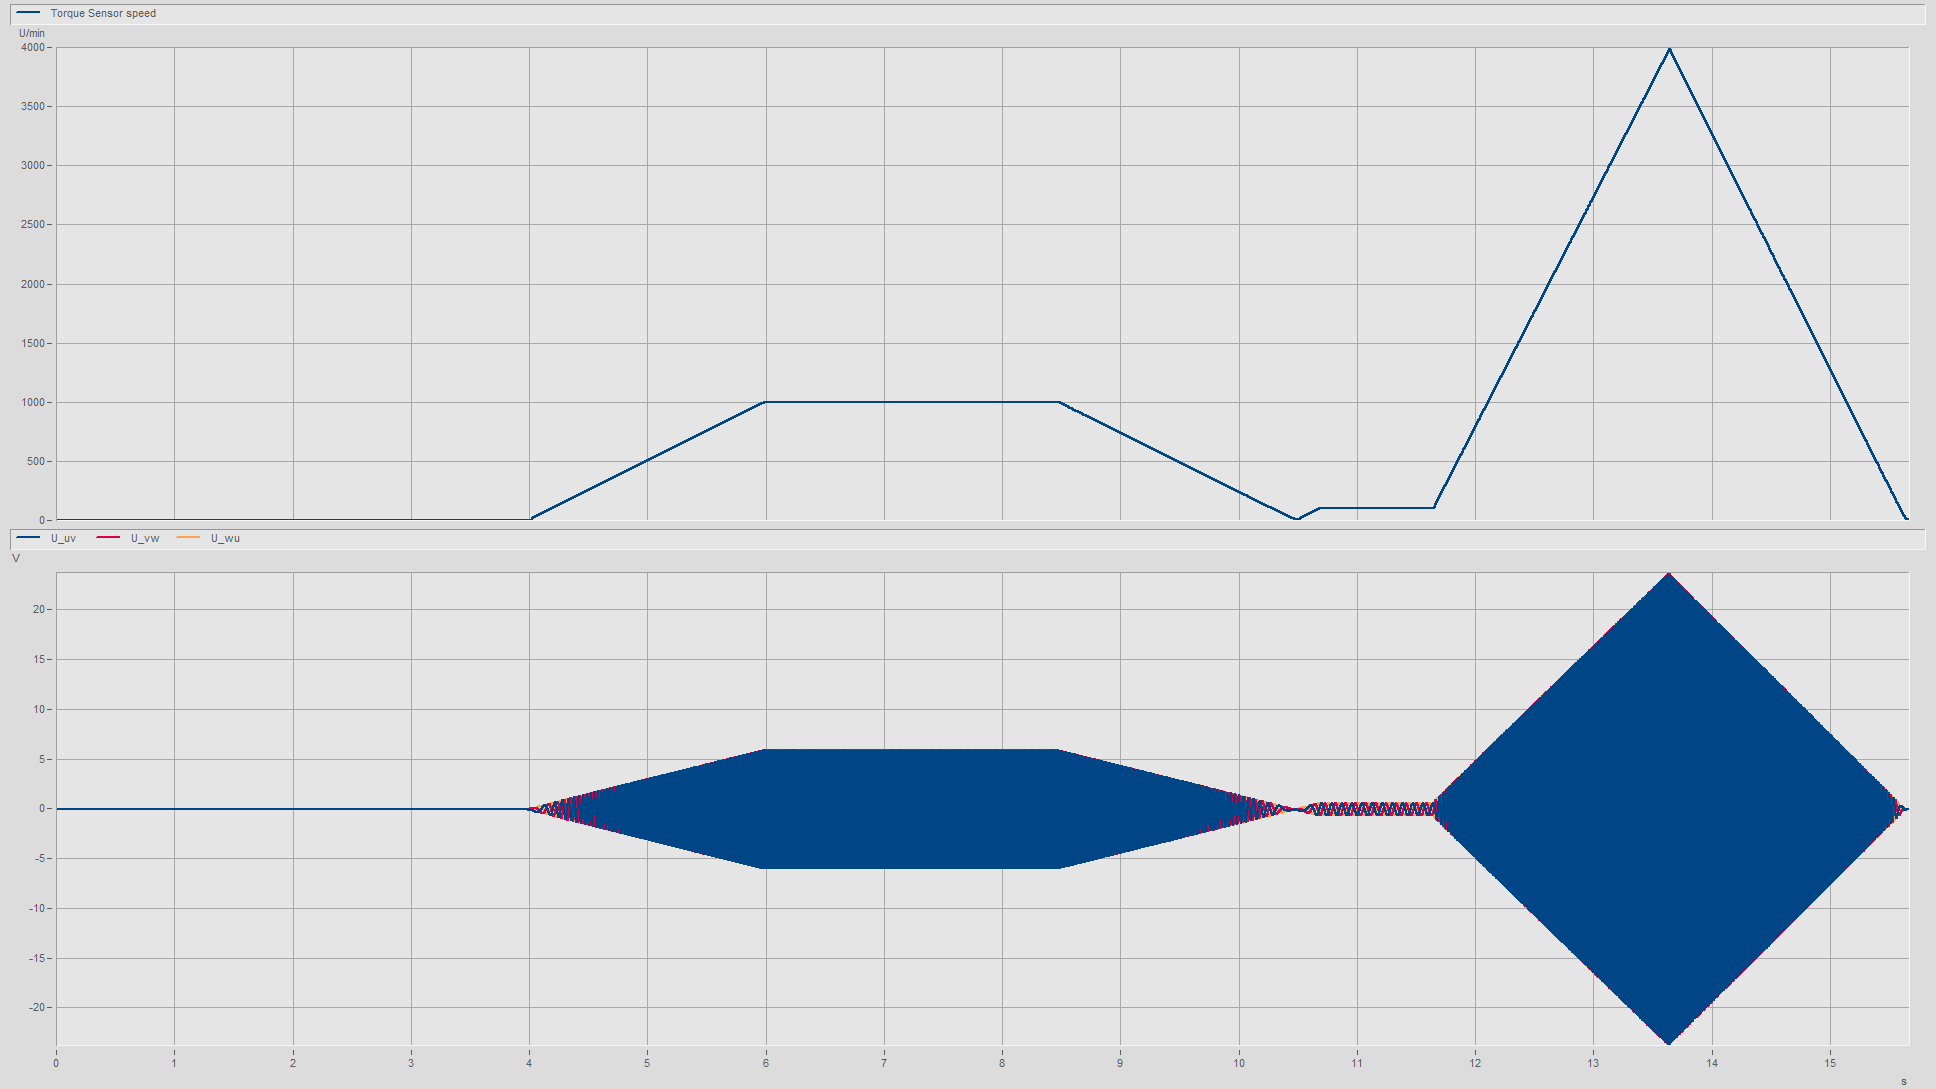
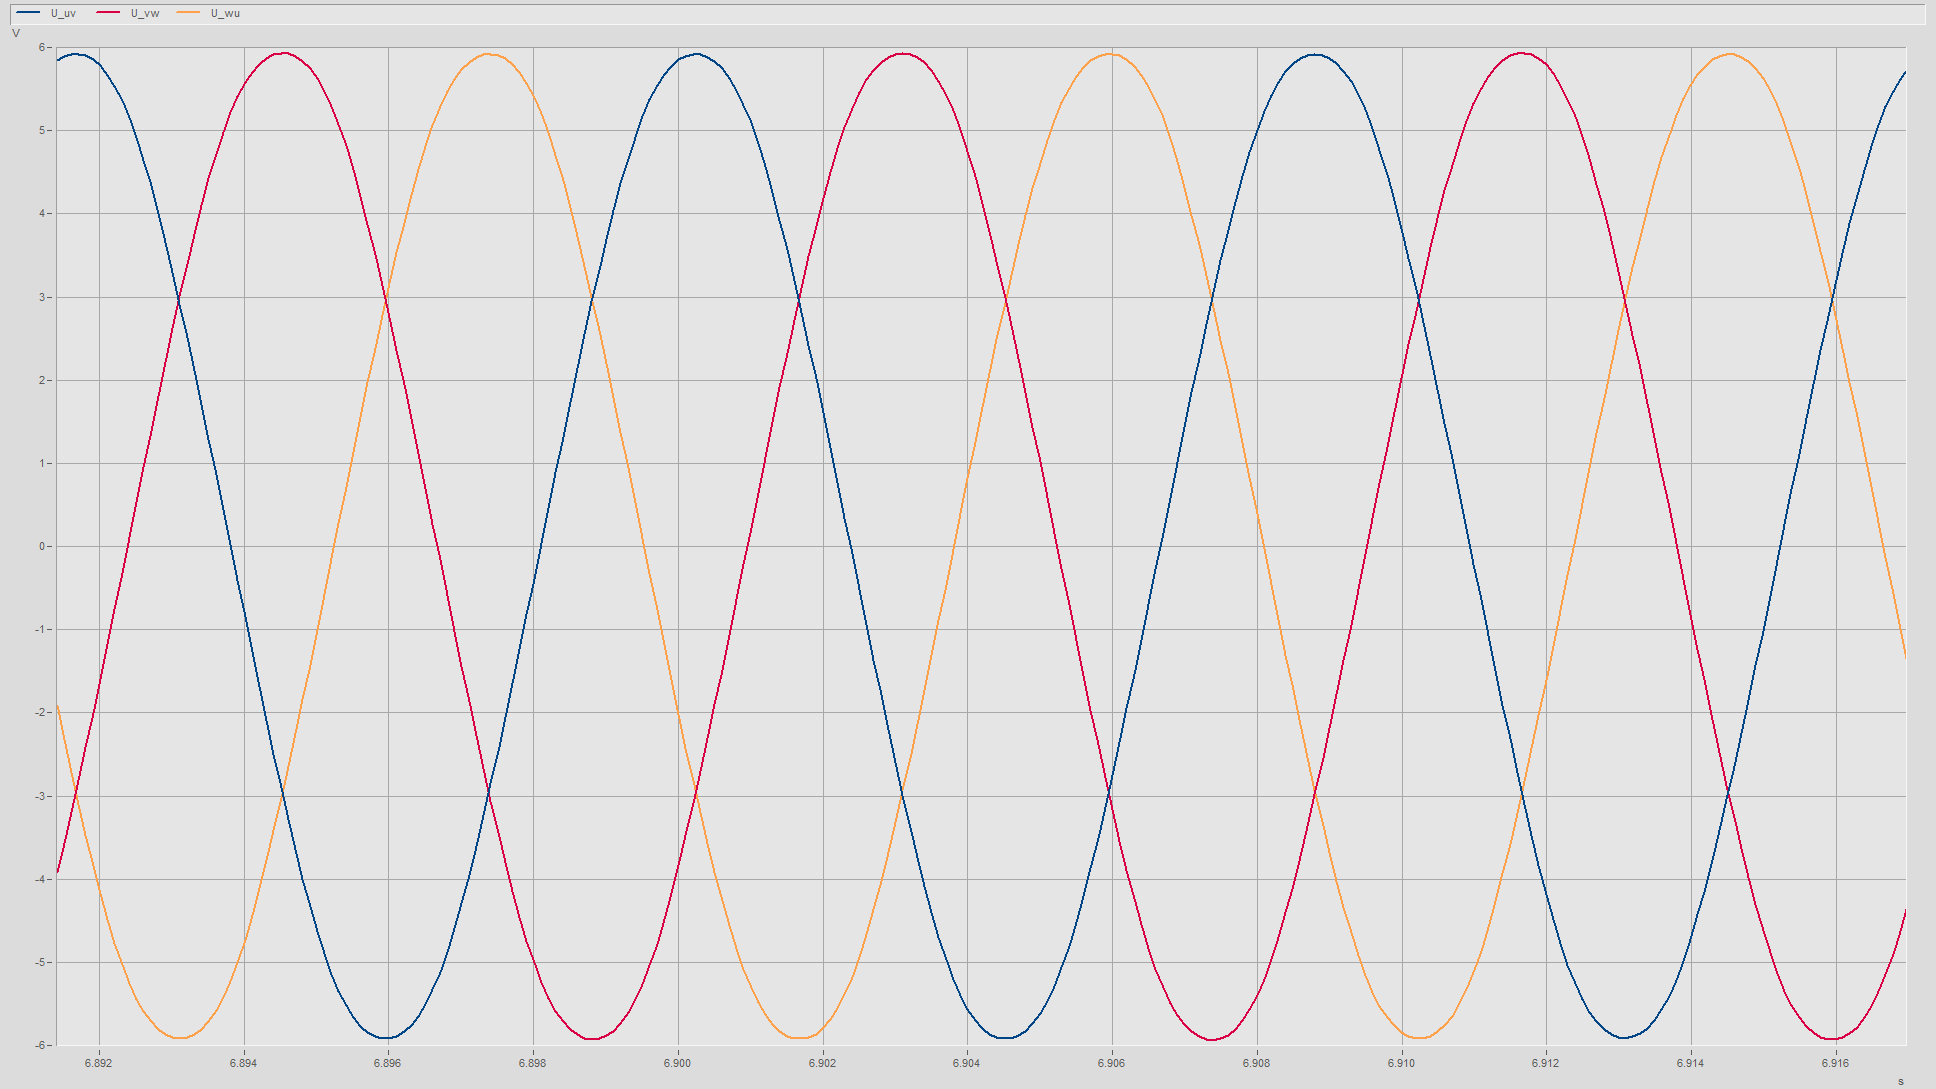
Permanent magnet synchronous motors that are driven externally induce a voltage that can be measured. The induced voltage is proportional to the speed and the excitation. The DUT is not controlled during the test.
The characteristic of the induced voltage provides information on the windings and the excitation. Induced voltage measurement is a simple method of diagnosing the electromagnetic structure of the device under test.
Description of the test procedure
The test specimen is coupled to the load machine of the test bench using a coupling. After the start of the test, the load machine drags the test specimen to a target speed over a preset time. The load machine keeps this target speed constant for the duration of the measurement data recording. Following the constant run, the test specimen is again accelerated to a speed point with a configurable ramp and then brought to a stop again.
Results of the test
- Induced motor voltages over the angle of rotation
- Order spectrum of motor voltages
- Distortion factor of the motor voltages
- Course of the induced voltage over the speed

Mit dem Laden des Videos akzeptieren Sie die Datenschutzerklärung von YouTube.
Mehr erfahren
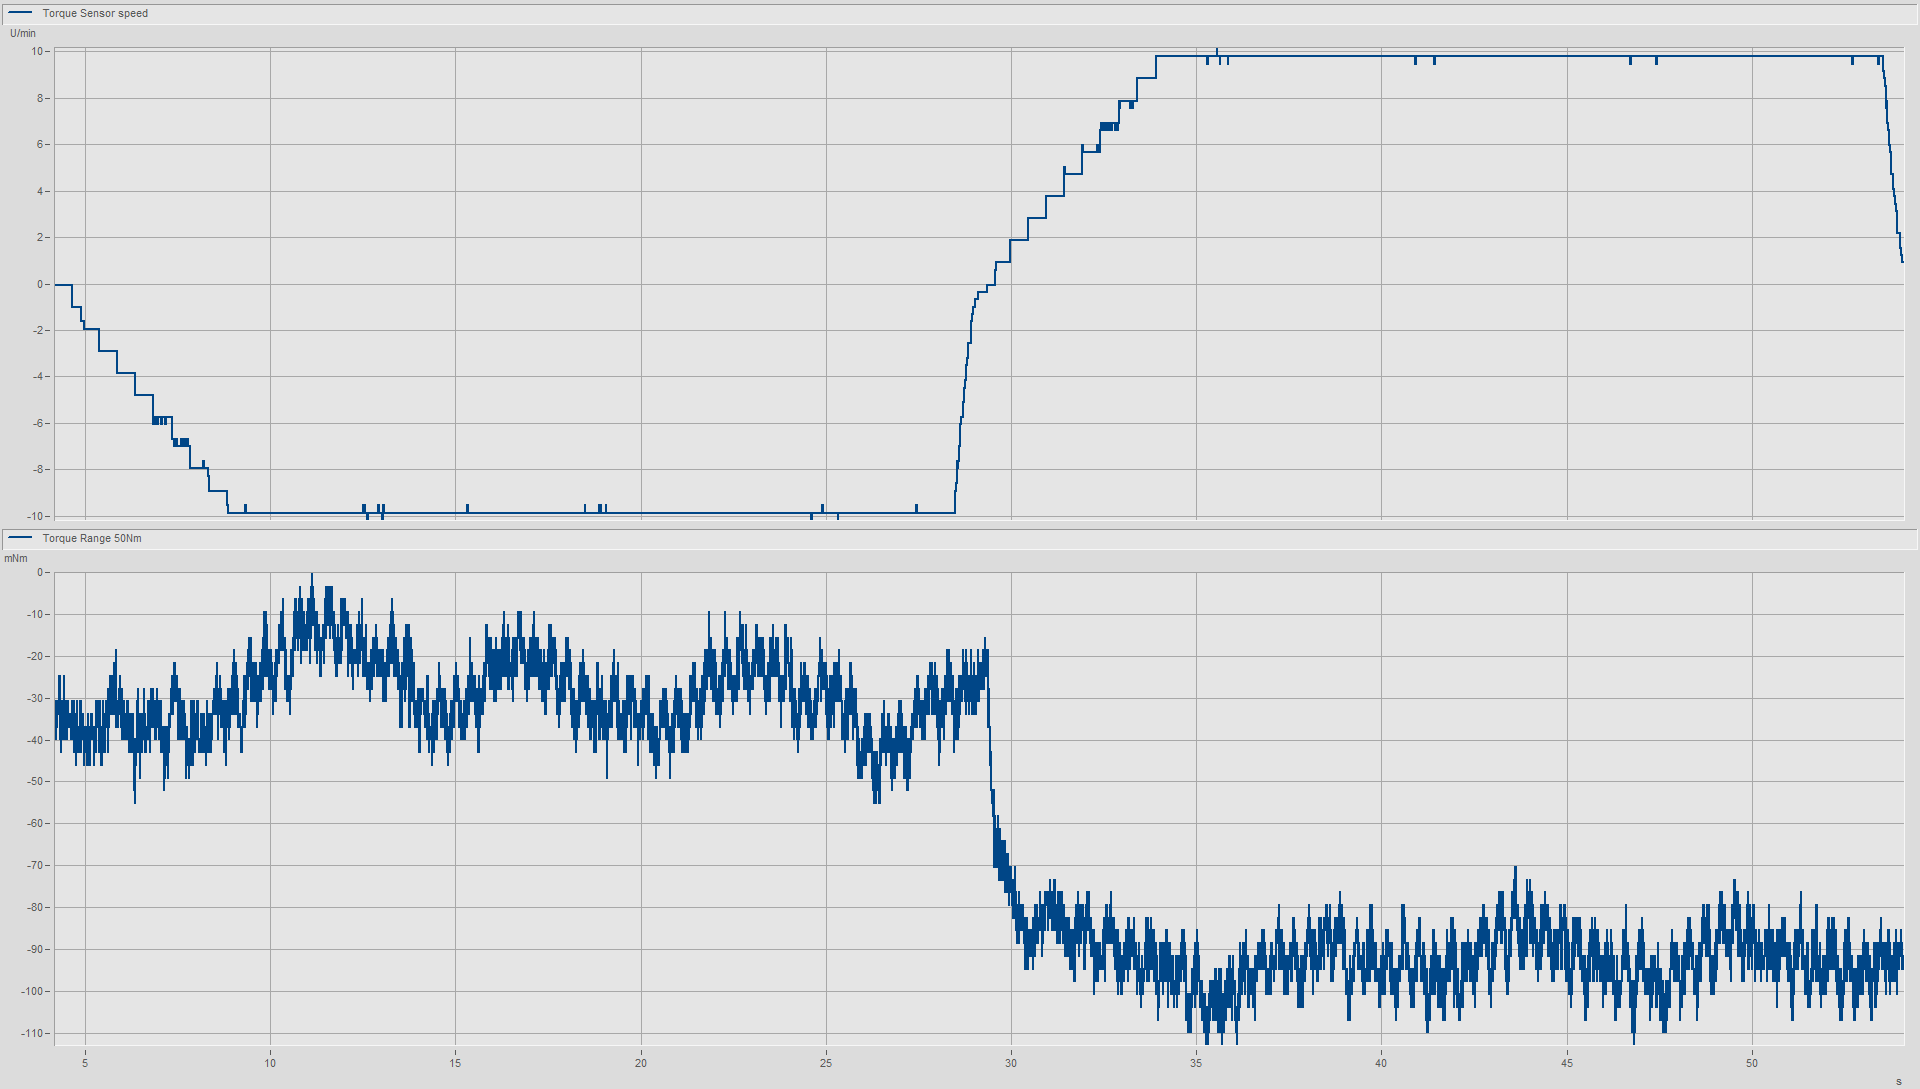
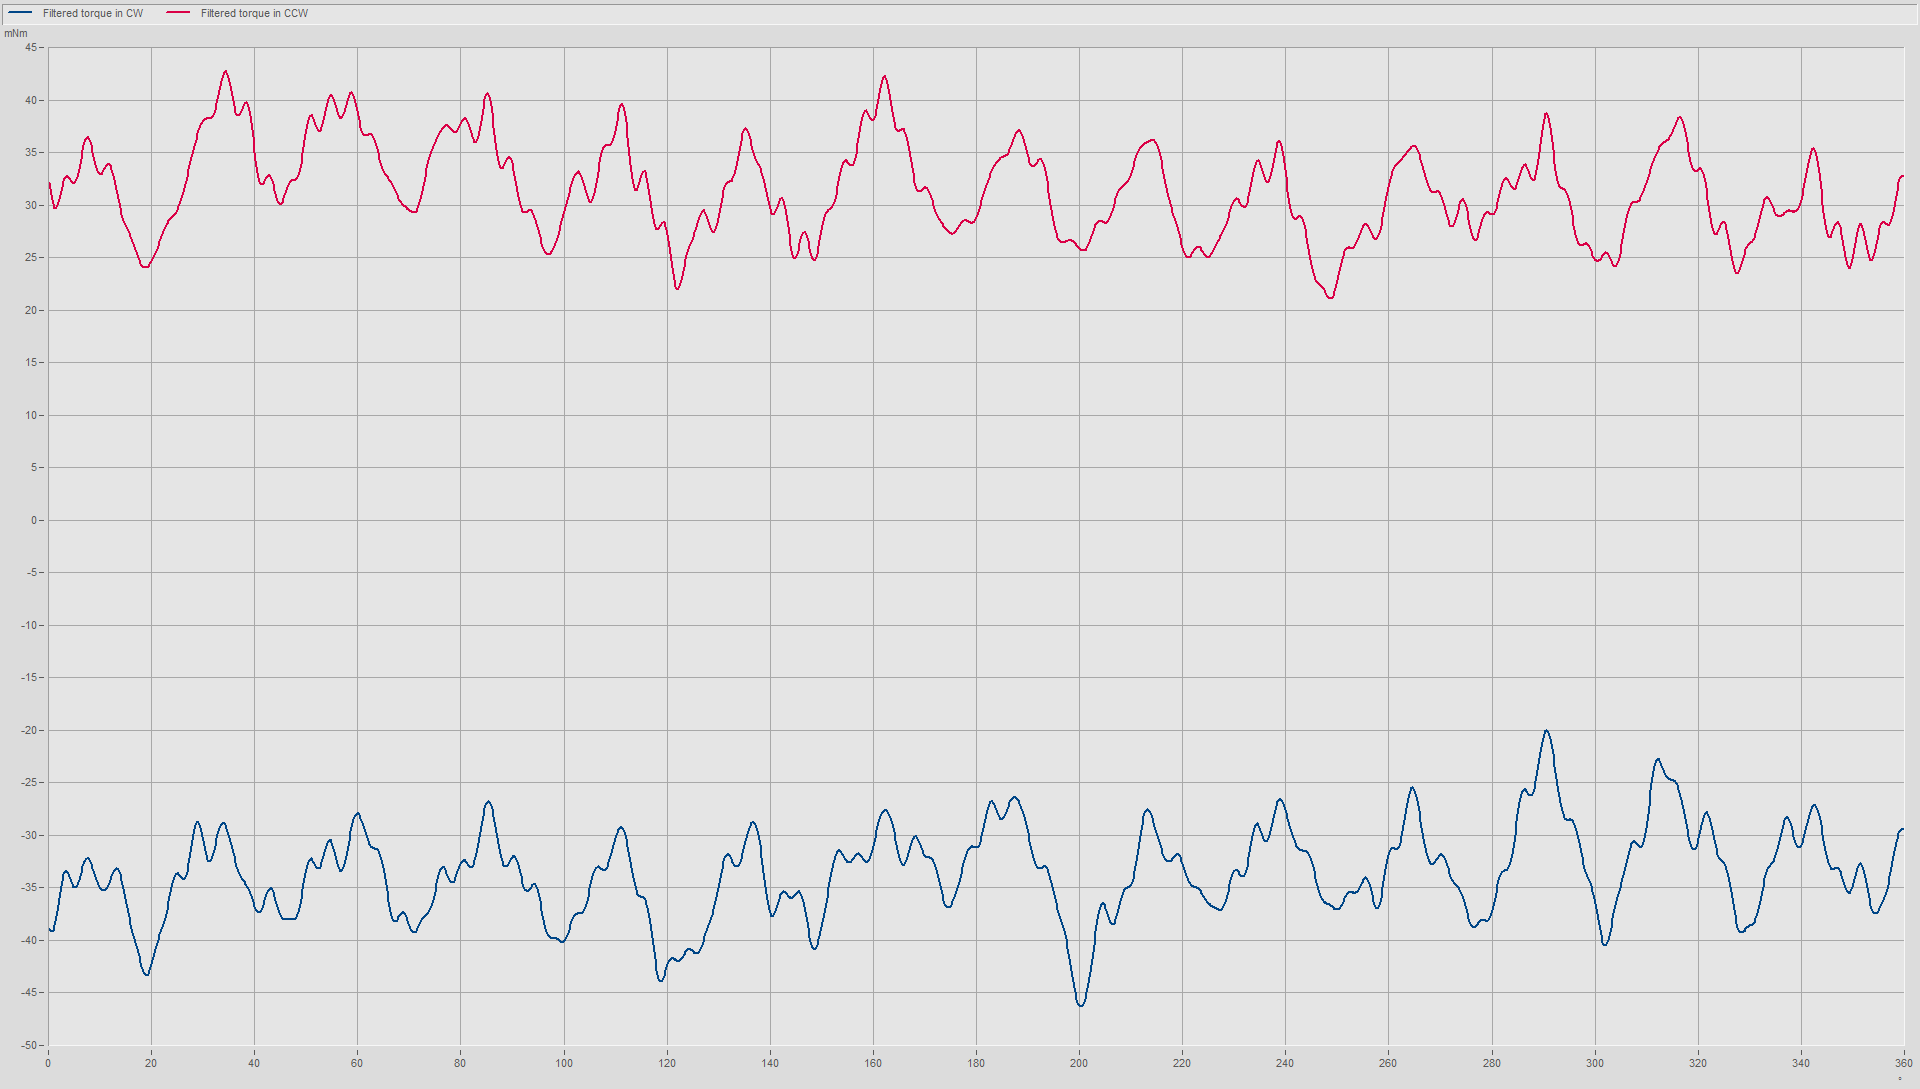
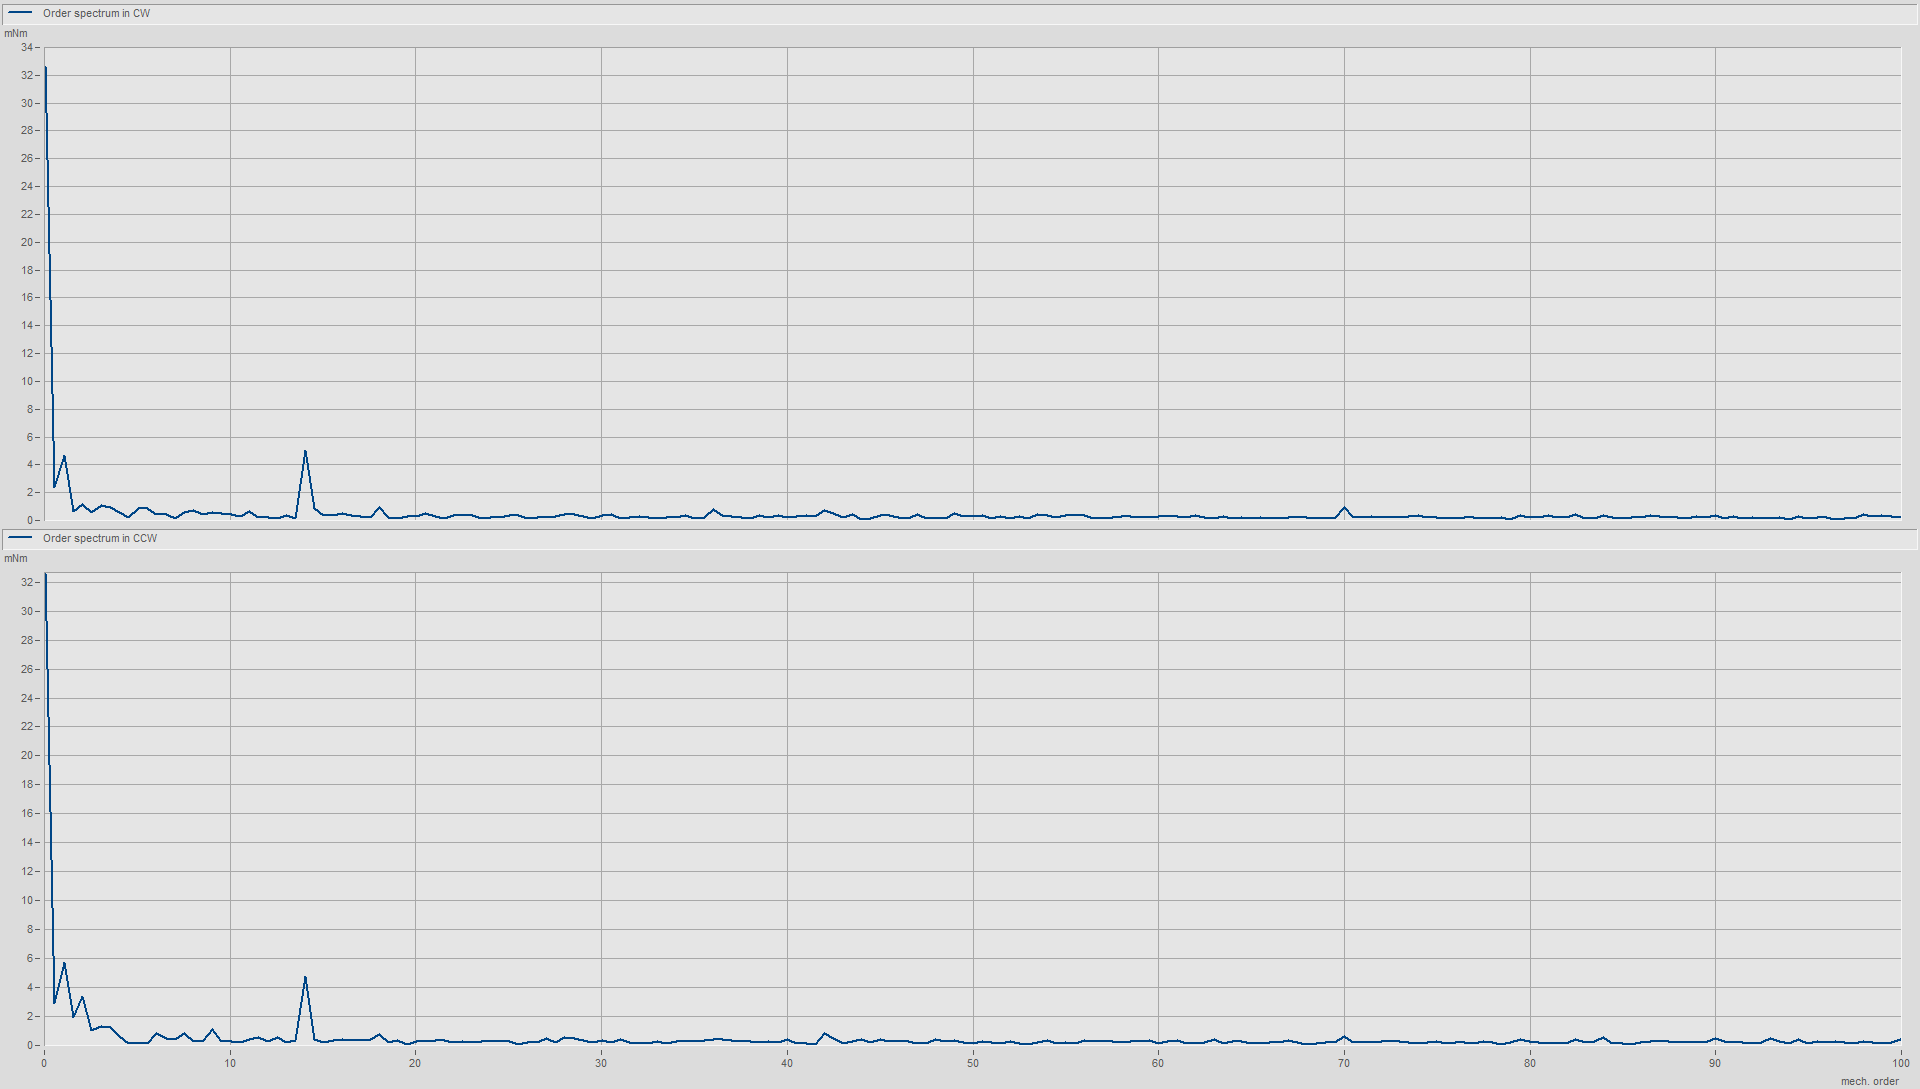
Cogging torque
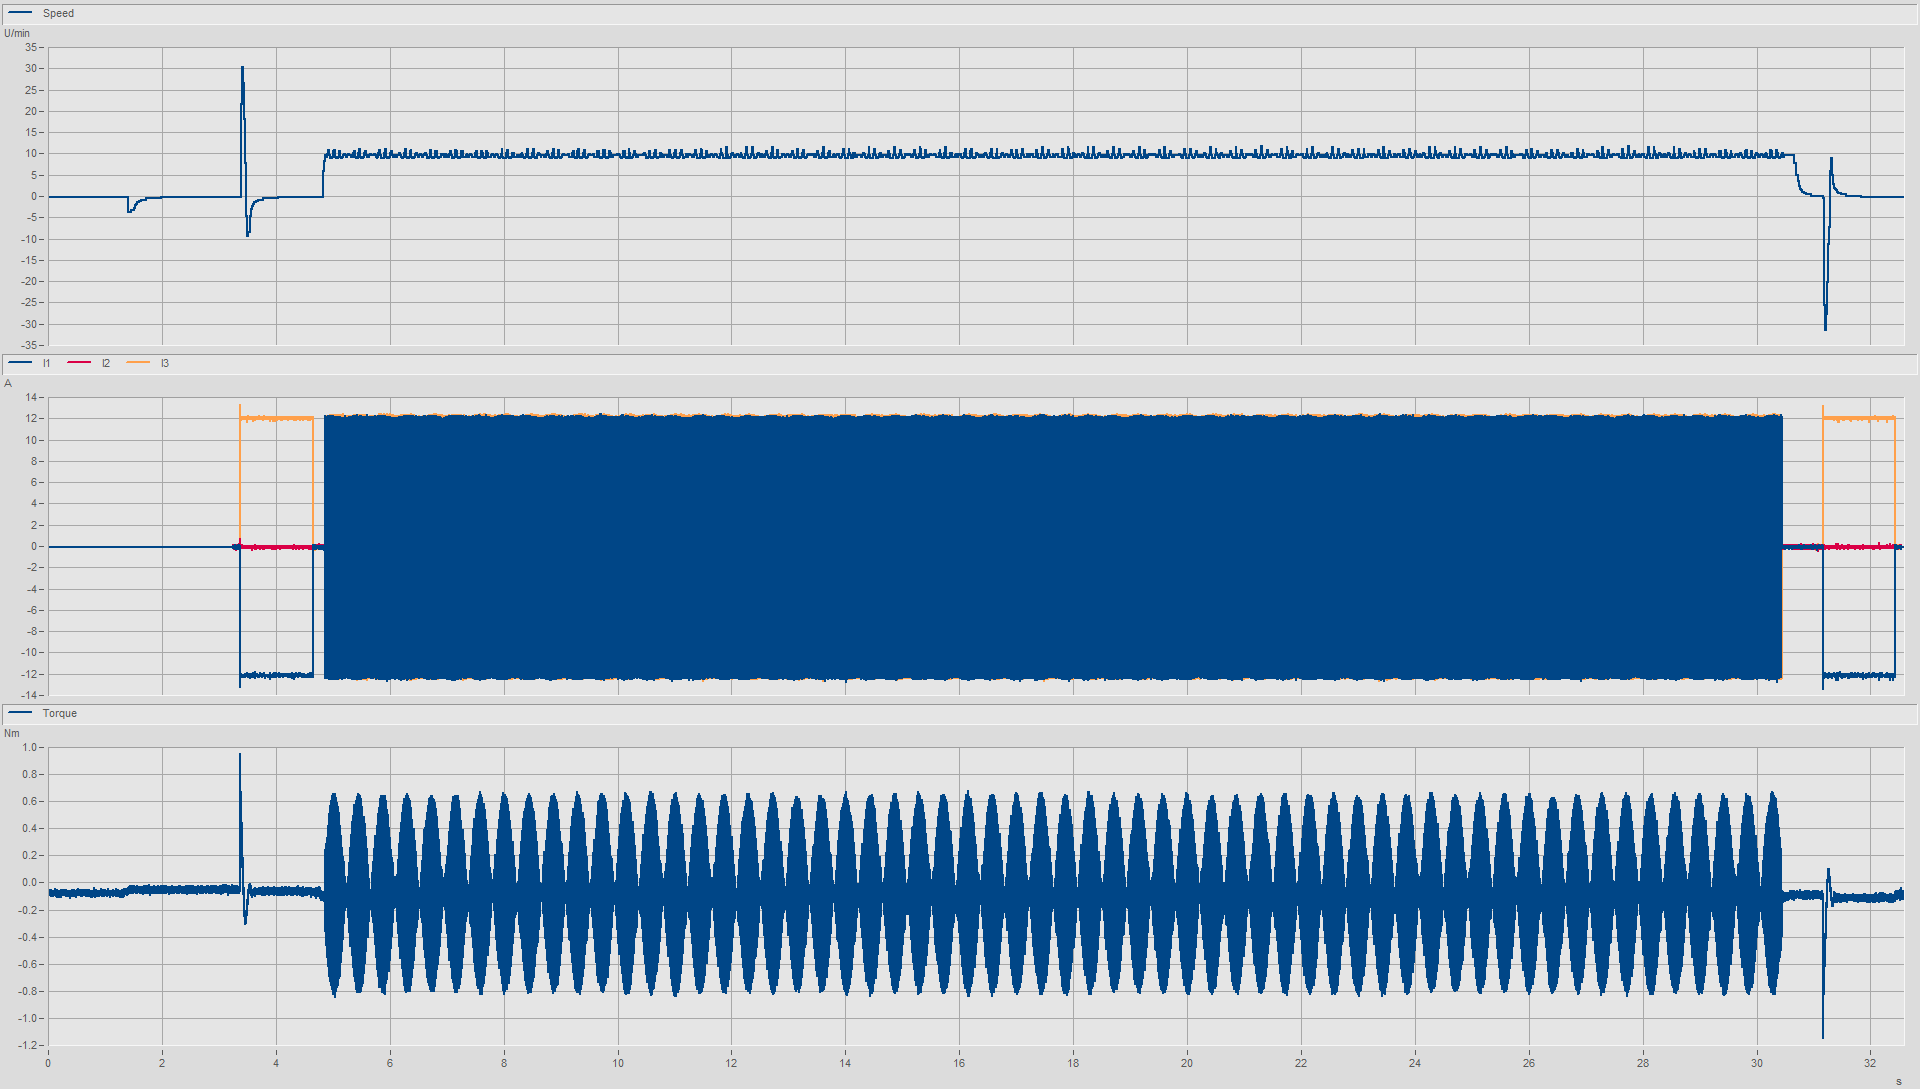
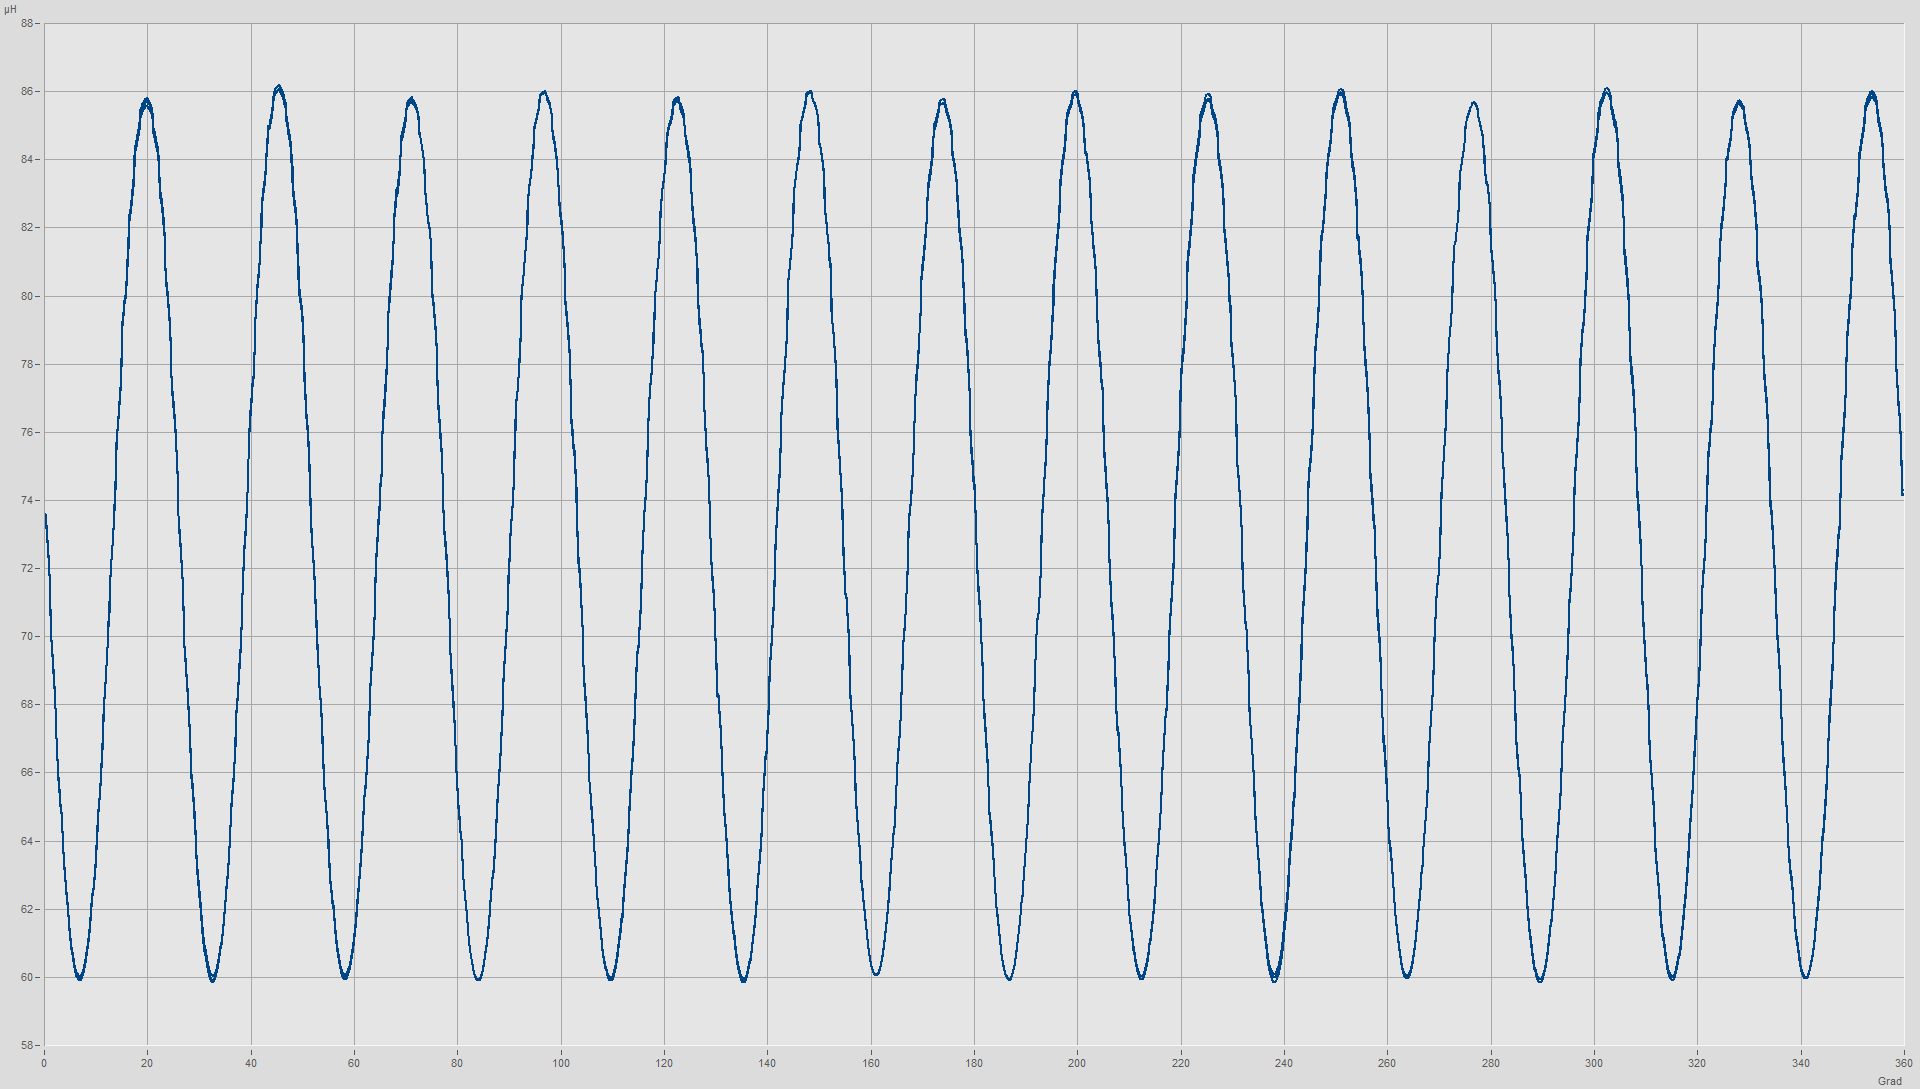
Cogging torques are generated in electric motors by the internal structure of the motor. They occur when the motor is spinning and can be measured at a slow speed. The DUT is not controlled during the test. The course of the measured moment provides information about the internal structure of the DUT. The measurement of the torque is a simple method to diagnose the electromagnetic structure of the motor.
Description of the test procedure
The test specimen is coupled to the load machine of the test bench using a coupling. After the start of the test, the load machine drags the test specimen to a target speed over a preset time. The load machine keeps this target speed constant for the duration of the measurement data recording. After completion of the measurement data recording, the load machine brakes the test specimen until it comes to a stop.
Results of the test
- Curve of the measured torque
- Plot of the torque versus the angle of rotation
- Order spectrum of the measured torque
- Average frictional torque over one revolution
- Peak-to-peak value of cogging torque

Mit dem Laden des Videos akzeptieren Sie die Datenschutzerklärung von YouTube.
Mehr erfahren
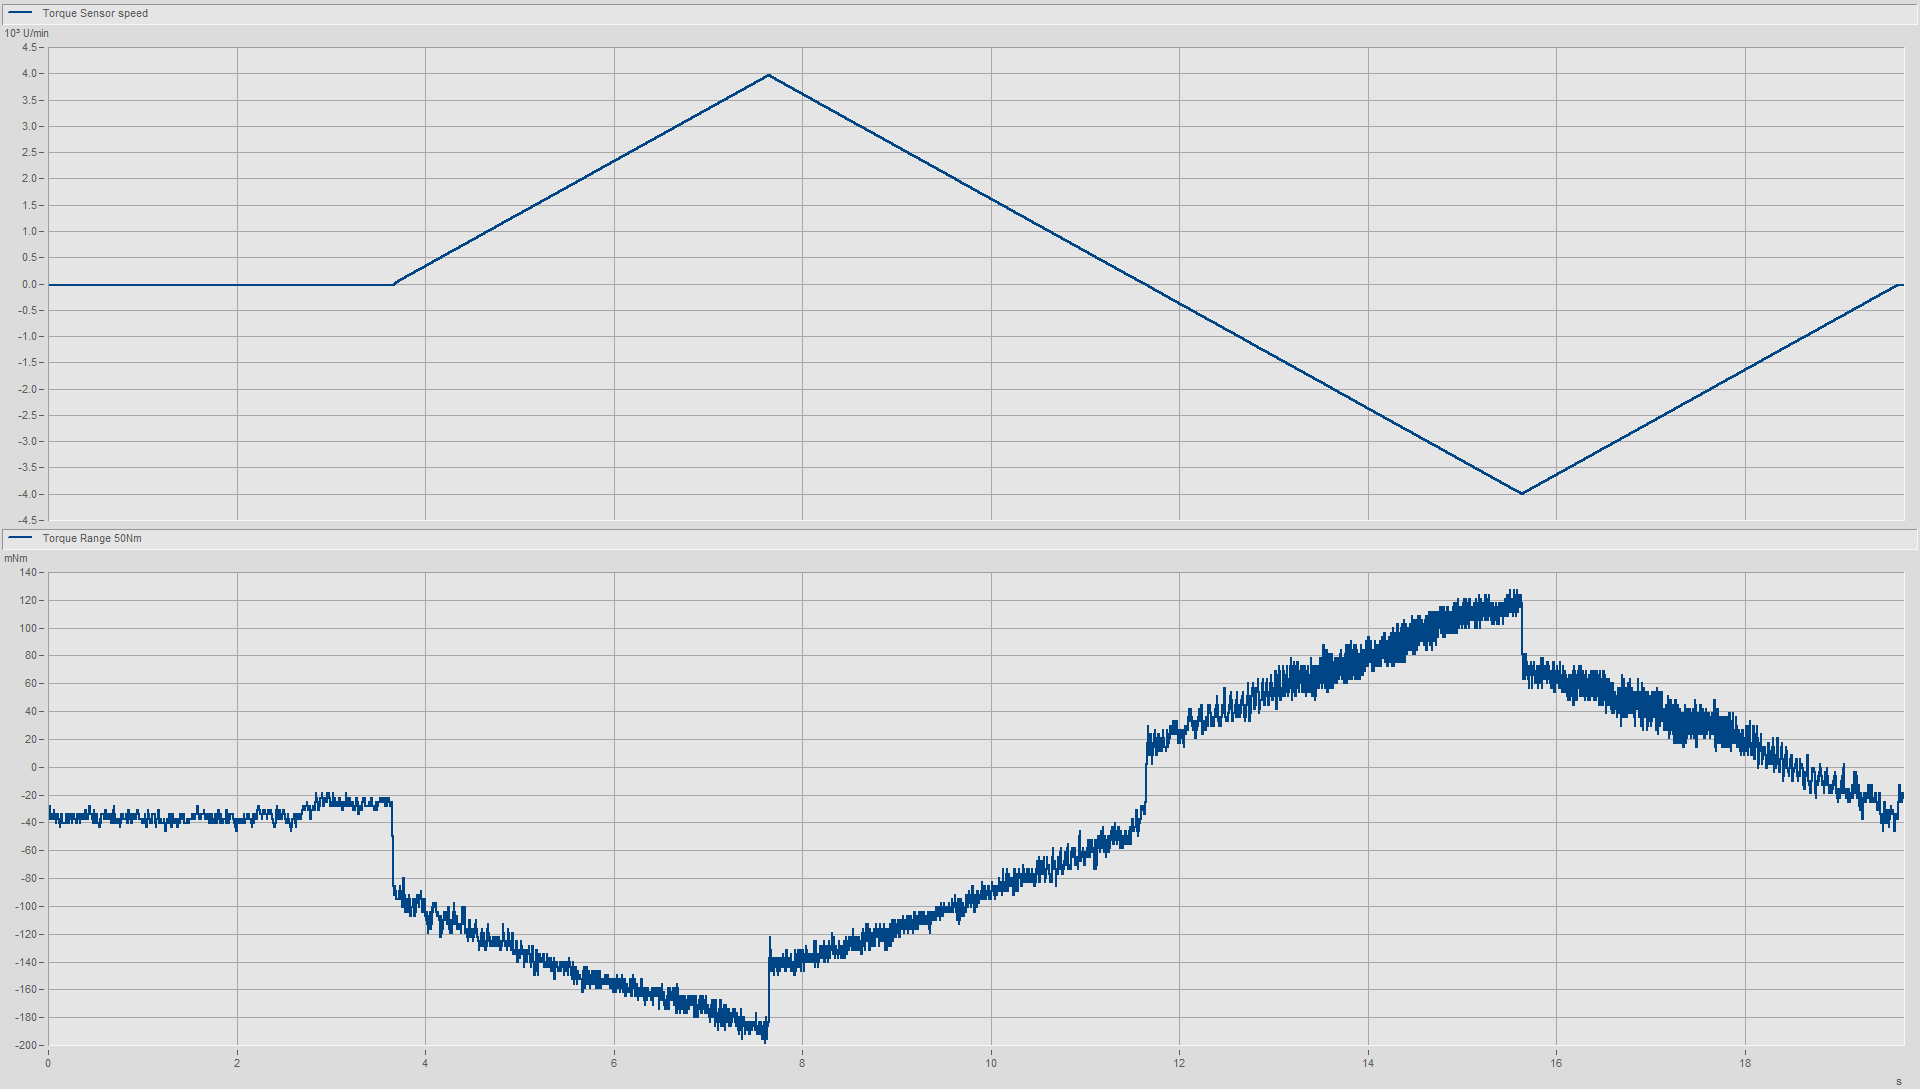
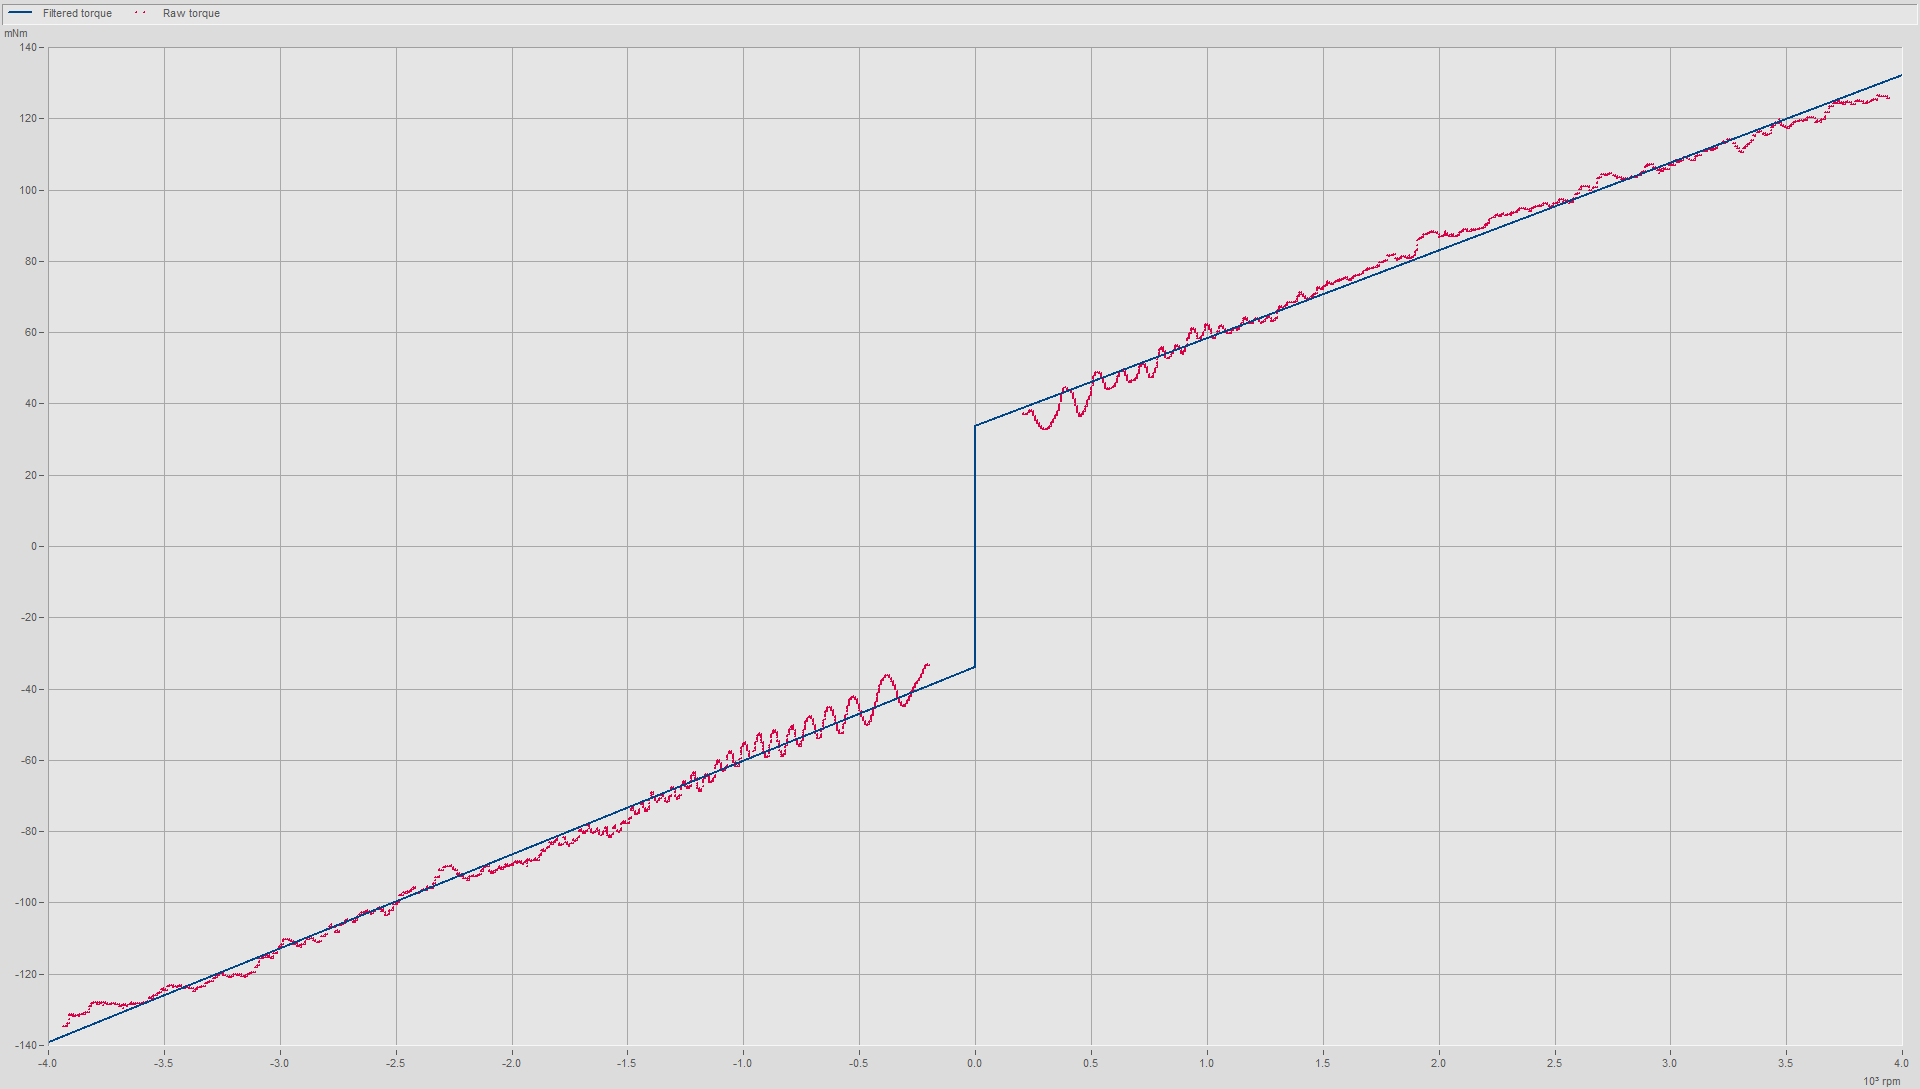
Drag torque
The drag torque test determines the loss torque of a passively dragged DUT as a function of speed. The average torque over one mechanical revolution is analyzed. The torque variation within one revolution can be determined by a cogging torque test. The drag torque is usually caused mainly by the bearing friction. However, other losses, such as eddy current torques in a permanently excited motor or the air friction of a permanently connected fan wheel, are also included in the measurement result. In addition, the inertia of the test specimen (plus coupling and measuring side of the measuring shaft) can be determined with the drag torque test.
Description of the test procedure
To measure the drag torque, the electrically non-contacted DUT is dragged by the load machine at a specified pitch to a defined speed and then brought to a stop again at the same gradient. The test is performed in both positive and negative directions of rotation.
Results of the test
- Curve of the drag torque
- Curve of the speed
- Drag torque above speed
- Table of individual operating points
- Static friction
- Dynamic friction
- Inertia

Mit dem Laden des Videos akzeptieren Sie die Datenschutzerklärung von YouTube.
Mehr erfahren
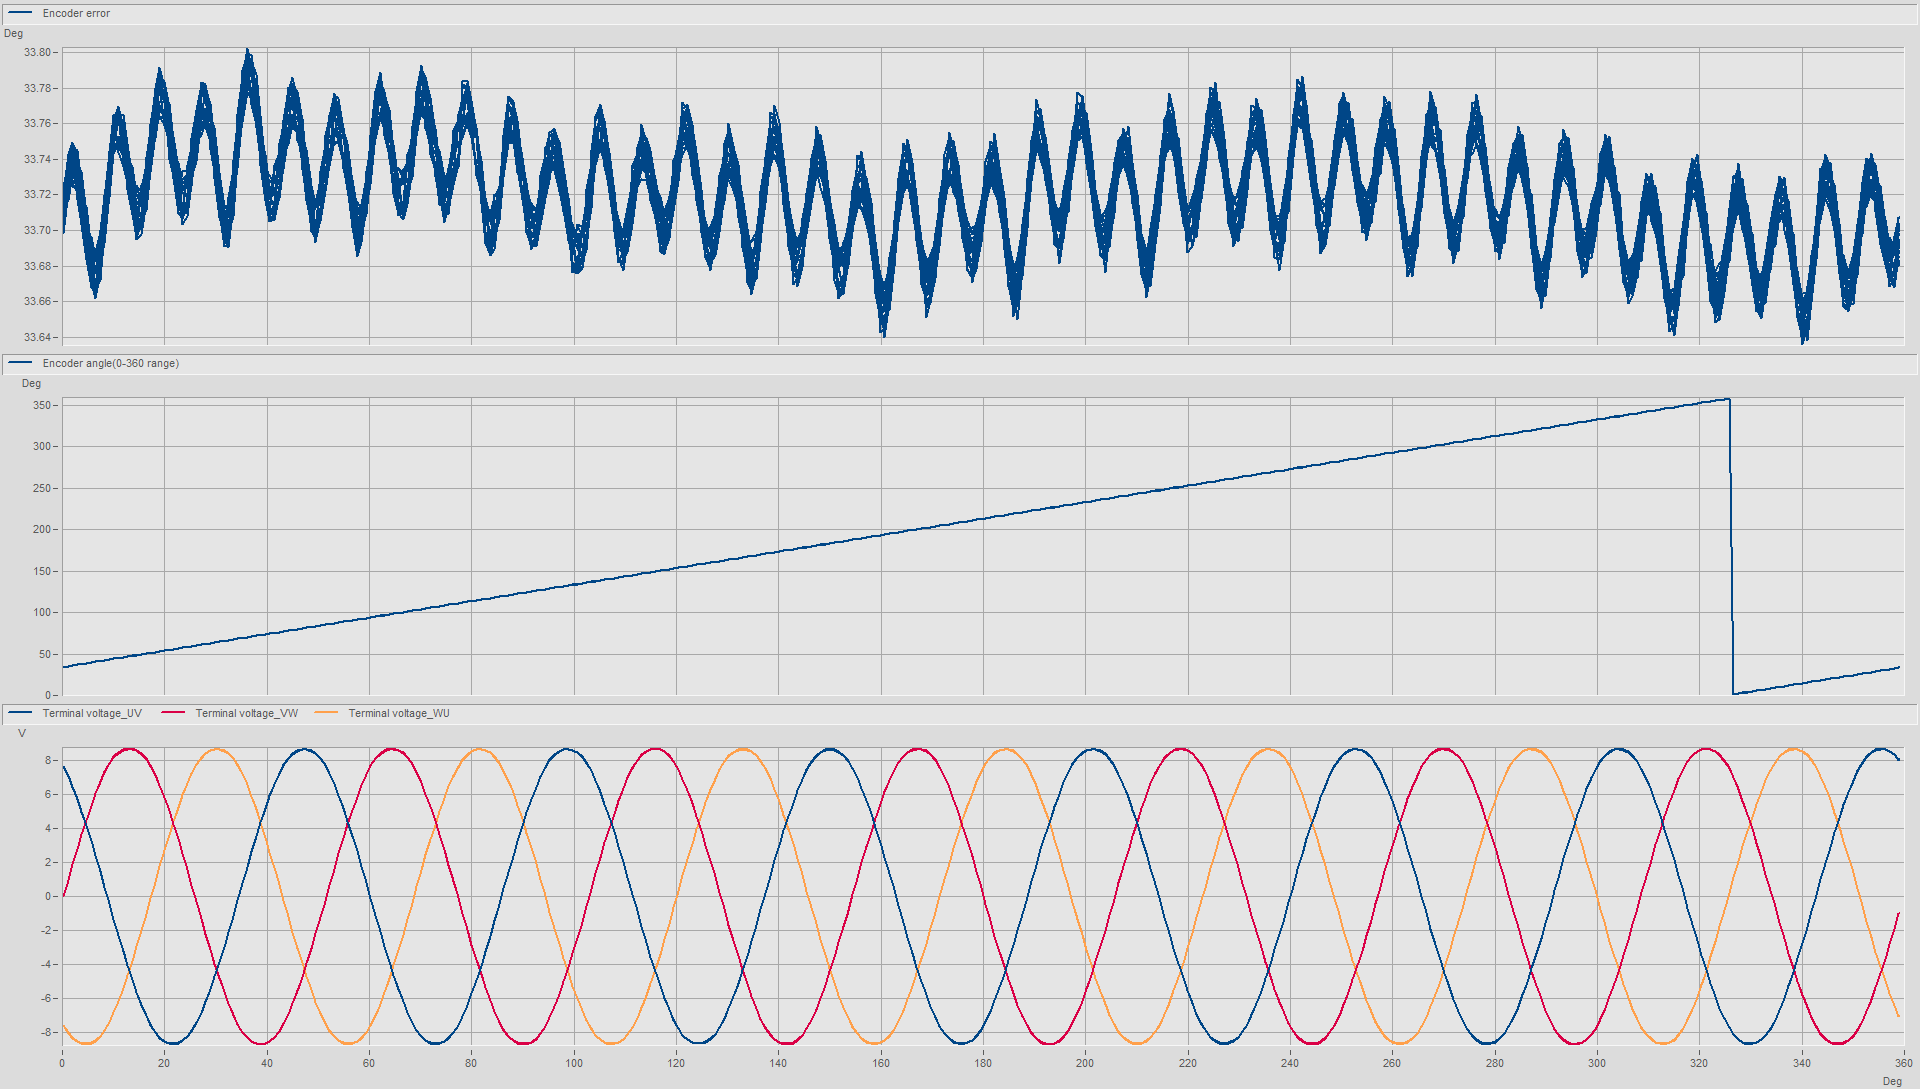
Encoder test
The encoder test is used to assess the quality of the DUT’s encoder. For this purpose, the signal output by the DUT encoder is compared with that of a reference encoder. In addition, the angle signal of the DUT encoder is displayed in relation to the generator voltage of the motor.
Description of the test procedure
The contacted DUT is dragged to a constant speed by the load machine. If the setpoint speed is reached, both the terminal voltages of the DUT and the angle signal of the encoder and the reference encoder signal are recorded during the test time.
Results of the test
- Error of encoder angle to reference angle over the reference angle
- Encoder angle over the reference angle
- Generator terminal voltages of the DUT over the reference angle

Mit dem Laden des Videos akzeptieren Sie die Datenschutzerklärung von YouTube.
Mehr erfahren
Active tests
Test types in which the test specimen is supplied with current, commutated and connected to a load machine are referred to as active test types.
Performance curve EC dynamic speed controlled
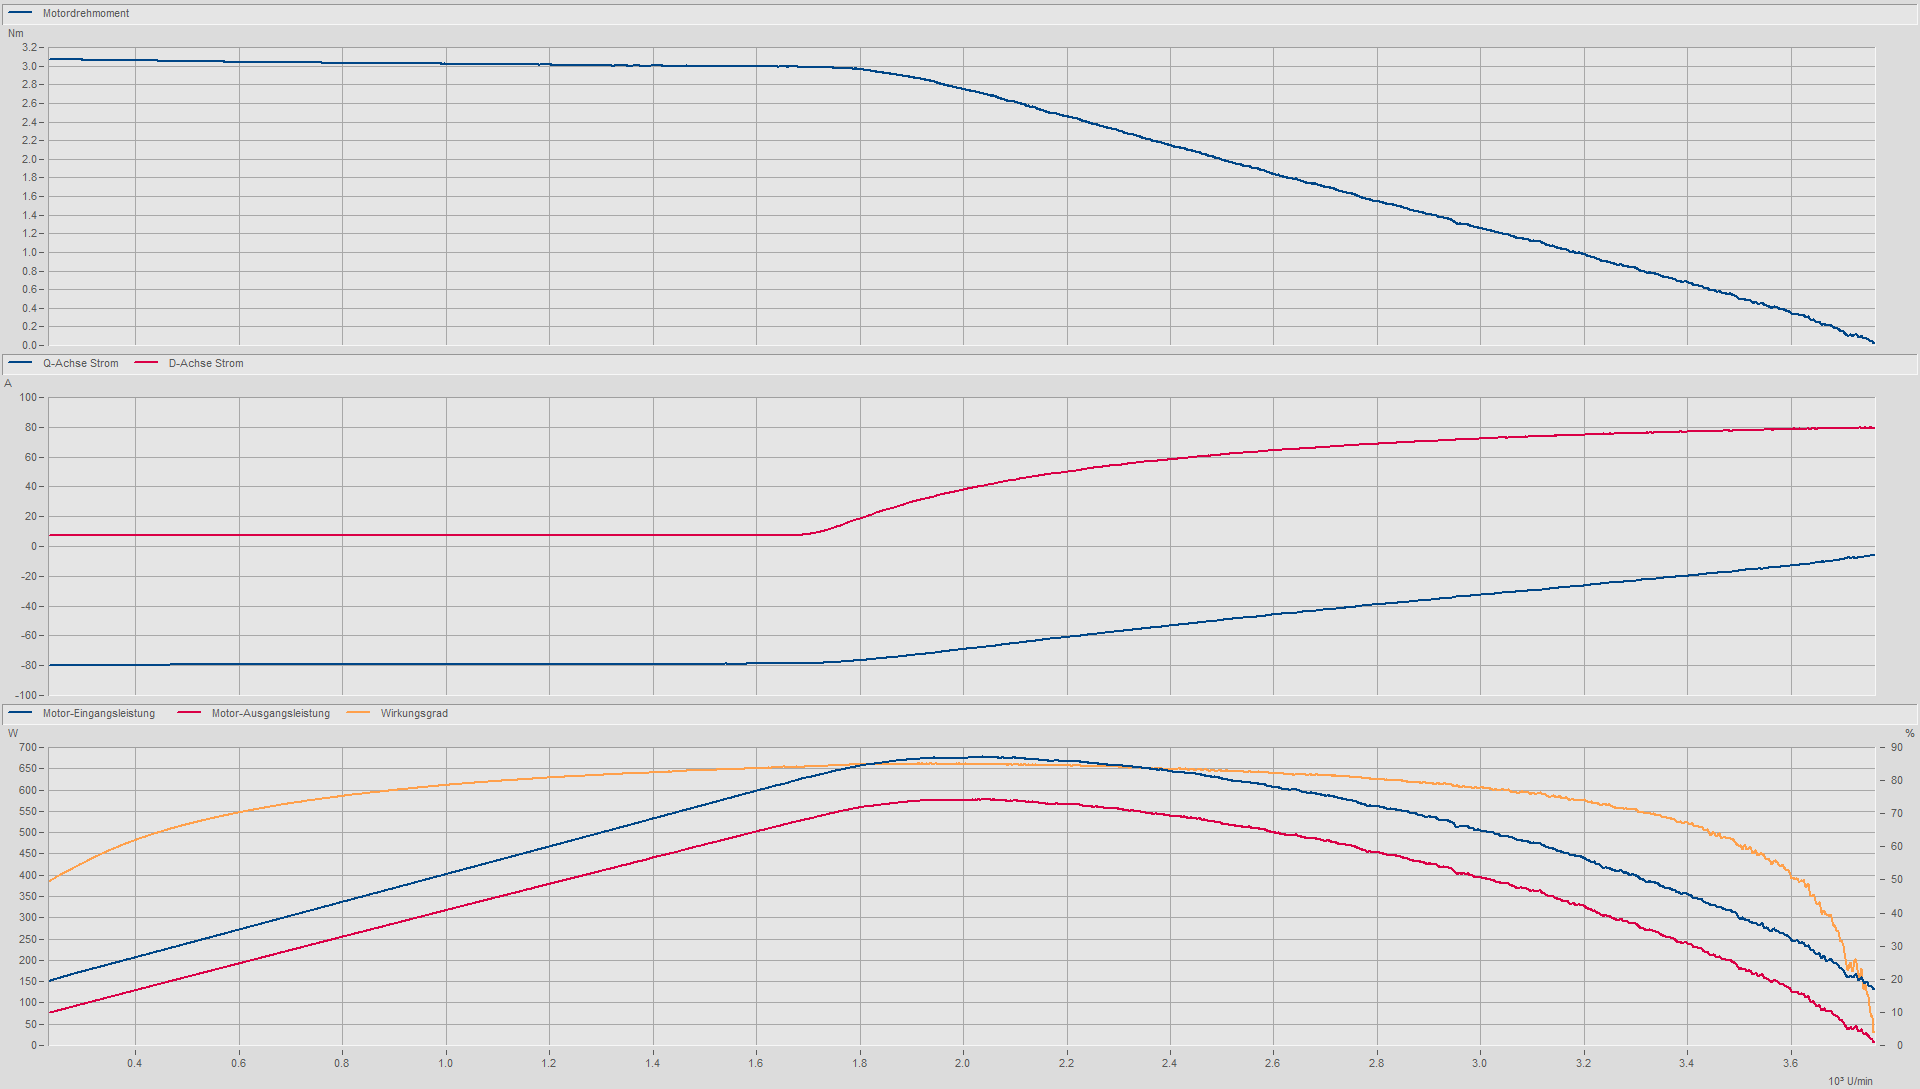
The performance curve test is used to determine the average behavior of the commutated motor over one revolution as a function of speed. Thus, the motor can be analyzed in its function as a converter of electrical to mechanical energy. For this purpose, currents, voltages and torque are recorded as a function of speed, and from this the electrically absorbed power, the mechanically delivered power, and the efficiency are determined. The performance curves determined depend on the control of the motor, in particular on the specification of the d and q currents over the speed. Characteristic testing can be used to determine the performance achievable with a particular control strategy to provide a starting point for further optimization.
The dynamic characteristic curve test measures the entire speed range of a test specimen in a short time. This minimizes the heating of the motor. If measurements are to be made in the thermally steady state or if the control speed of the DUT current controller is not sufficient, a static performance test is the better choice.
The test can only be used for current-controlled DUTs. If the DUT cannot be operated in this mode, the torque-controlled performance curve test must be used.
Description of the test procedure
At the beginning of the test, the DUT is dragged by the load machine with the gradient to the starting speed and then the current is switched on. During a parameterizable idle time, the test specimen oscillates so that a stationary torque is established on the shaft. After this waiting time, the speed of the load machine is increased linearly from the steady-state start speed to the stop speed. After the stop speed has been reached, the system first waits for the test specimen to settle. The load machine then drives the test specimen to the start speed again in the switched-on state. This double ramp travel allows the torque characteristic to be corrected for the component of the inertia. When the start speed is reached again, the test current is switched off. After a further settling time, the load machine brings the test specimen to a stop by moving down a linear ramp with the gradient. At the end of the test, the load machine drags the passive test specimen up and down a ramp. This is used to determine the commutation angle for the evaluation of the performance curve run.
Results of the test
- Torque curve versus speed
- Current curve versus speed
- Voltage curves versus speed
- Efficiency versus speed
- Input power versus speed
- Output power versus speed
- Current curve versus speed in the d-axis
- Current curve versus speed in the q-axis
- Voltage curve versus speed in the d-axis
- Voltage curve versus speed in the q-axis

Mit dem Laden des Videos akzeptieren Sie die Datenschutzerklärung von YouTube.
Mehr erfahren
Performance curve EC static speed controlled
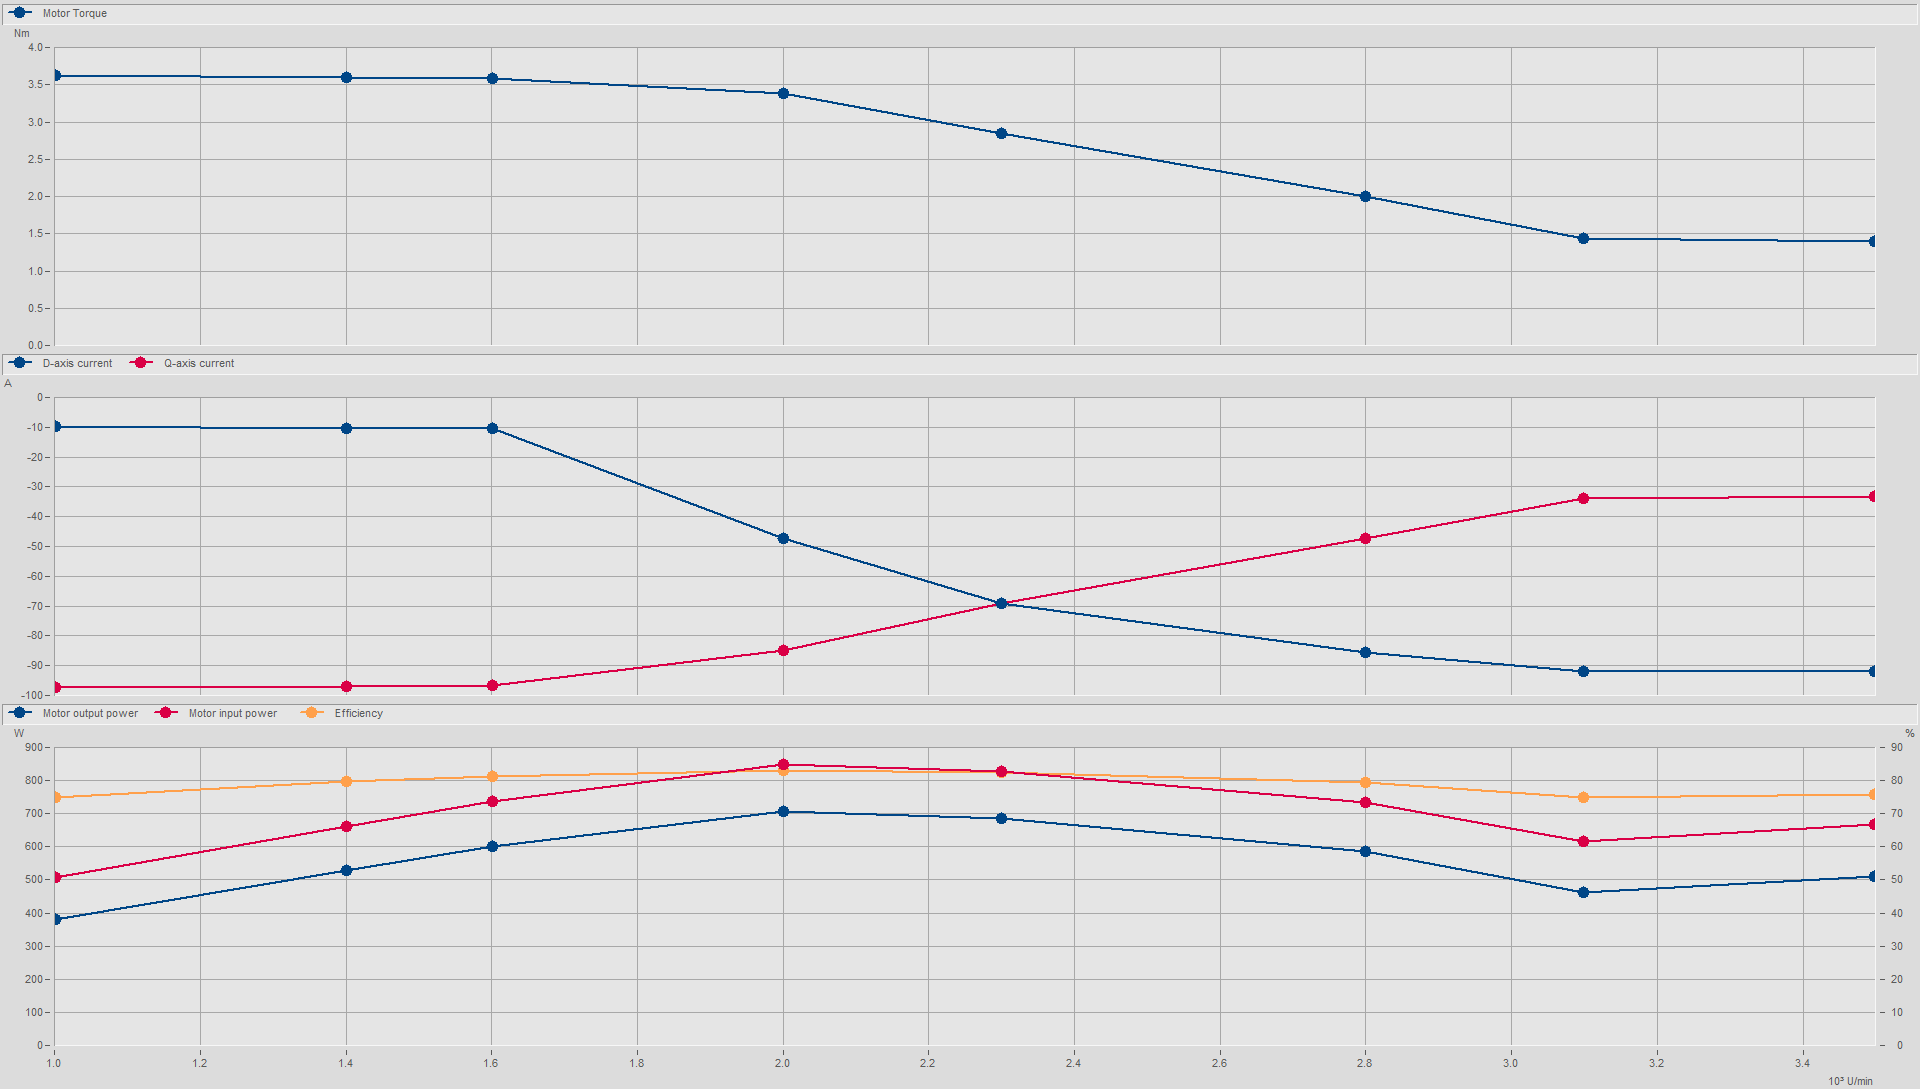
The performance curve test determines the average behavior of the motor over one revolution as a function of the speed. The focus is on characterizing the properties of the motor as a converter of electrical to mechanical energy. For this purpose, currents, voltages and torque are measured as a function of speed and thus the electrically absorbed power, the mechanically delivered power, and the efficiency are determined. The characteristic curves determined are always dependent on the control of the motor, in particular on the specification of d and q current over the speed. The characteristic test determines the performance of the control strategy and is the starting point for further optimization of the control algorithm.
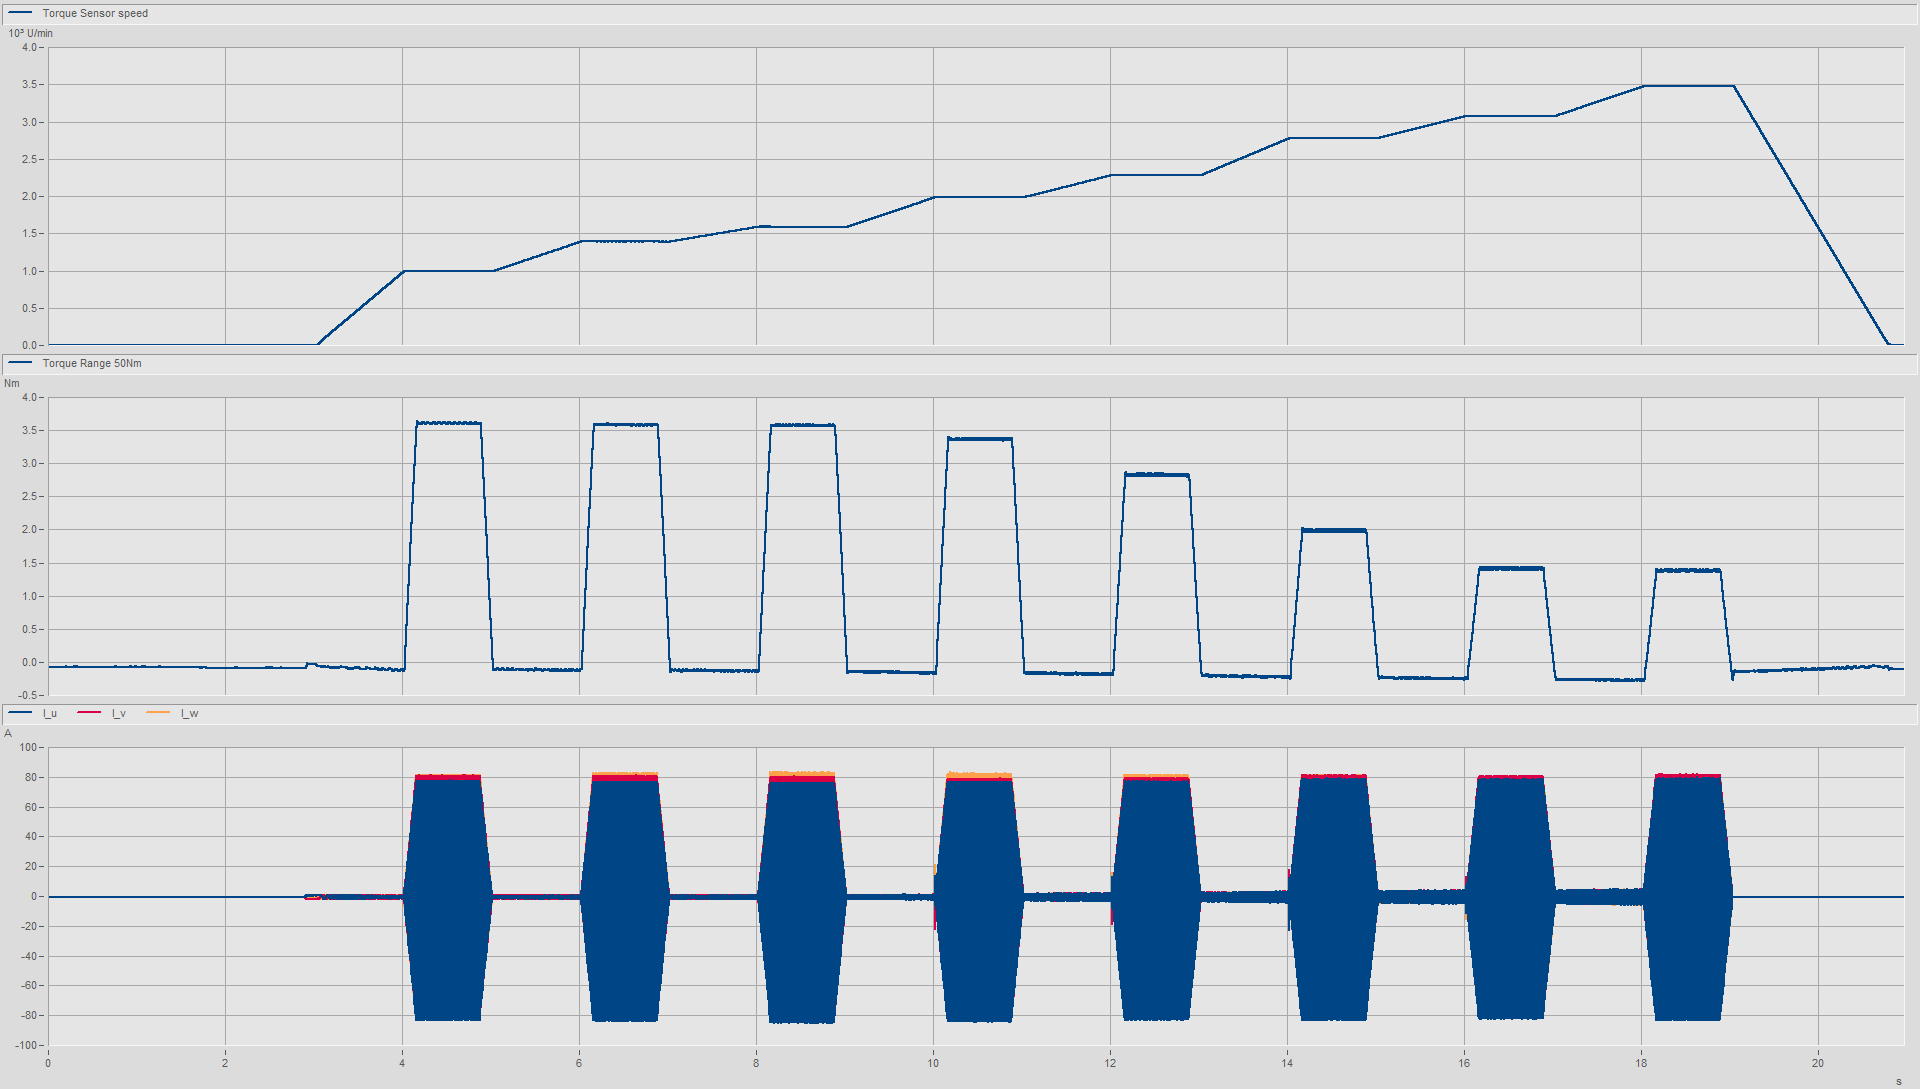
The static performance curve test measures the behavior of the motor at various specified constant speeds. Measurement is made over a time interval that starts when the desired speed is reached and the motor current has stabilized. Compared to the dynamic characteristic curve test, in which the entire speed range is measured, the static method can only make conclusions regarding the measured operating points, but these are generally more accurate. Above all, the dynamics of the DUT current controller has a much smaller influence here.
Description of the test procedure
The load machine drags the active DUT to the first speed n1. After a settling process, a stationary moment is applied to the measuring shaft and the measuring time is started. This procedure is repeated after the measuring time has elapsed for the other speeds n2 to n8. The test current and current angle for the individual speeds, which result in a maximum torque, can be taken from the measurement data of the flux table measurement for the individual speeds.
Results of the test
- Torque curve versus speed
- Current curve versus speed
- Voltage curves versus speed
- Efficiency curve versus speed
- Electrical input power curve versus speed
- Mechanical output power curve versus speed
- Current curve versus speed in the d-axis
- Current curve versus speed in the q-axis
- Voltage curve versus speed in the d-axis
- Voltage curve versus speed in the q-axis

Mit dem Laden des Videos akzeptieren Sie die Datenschutzerklärung von YouTube.
Mehr erfahren
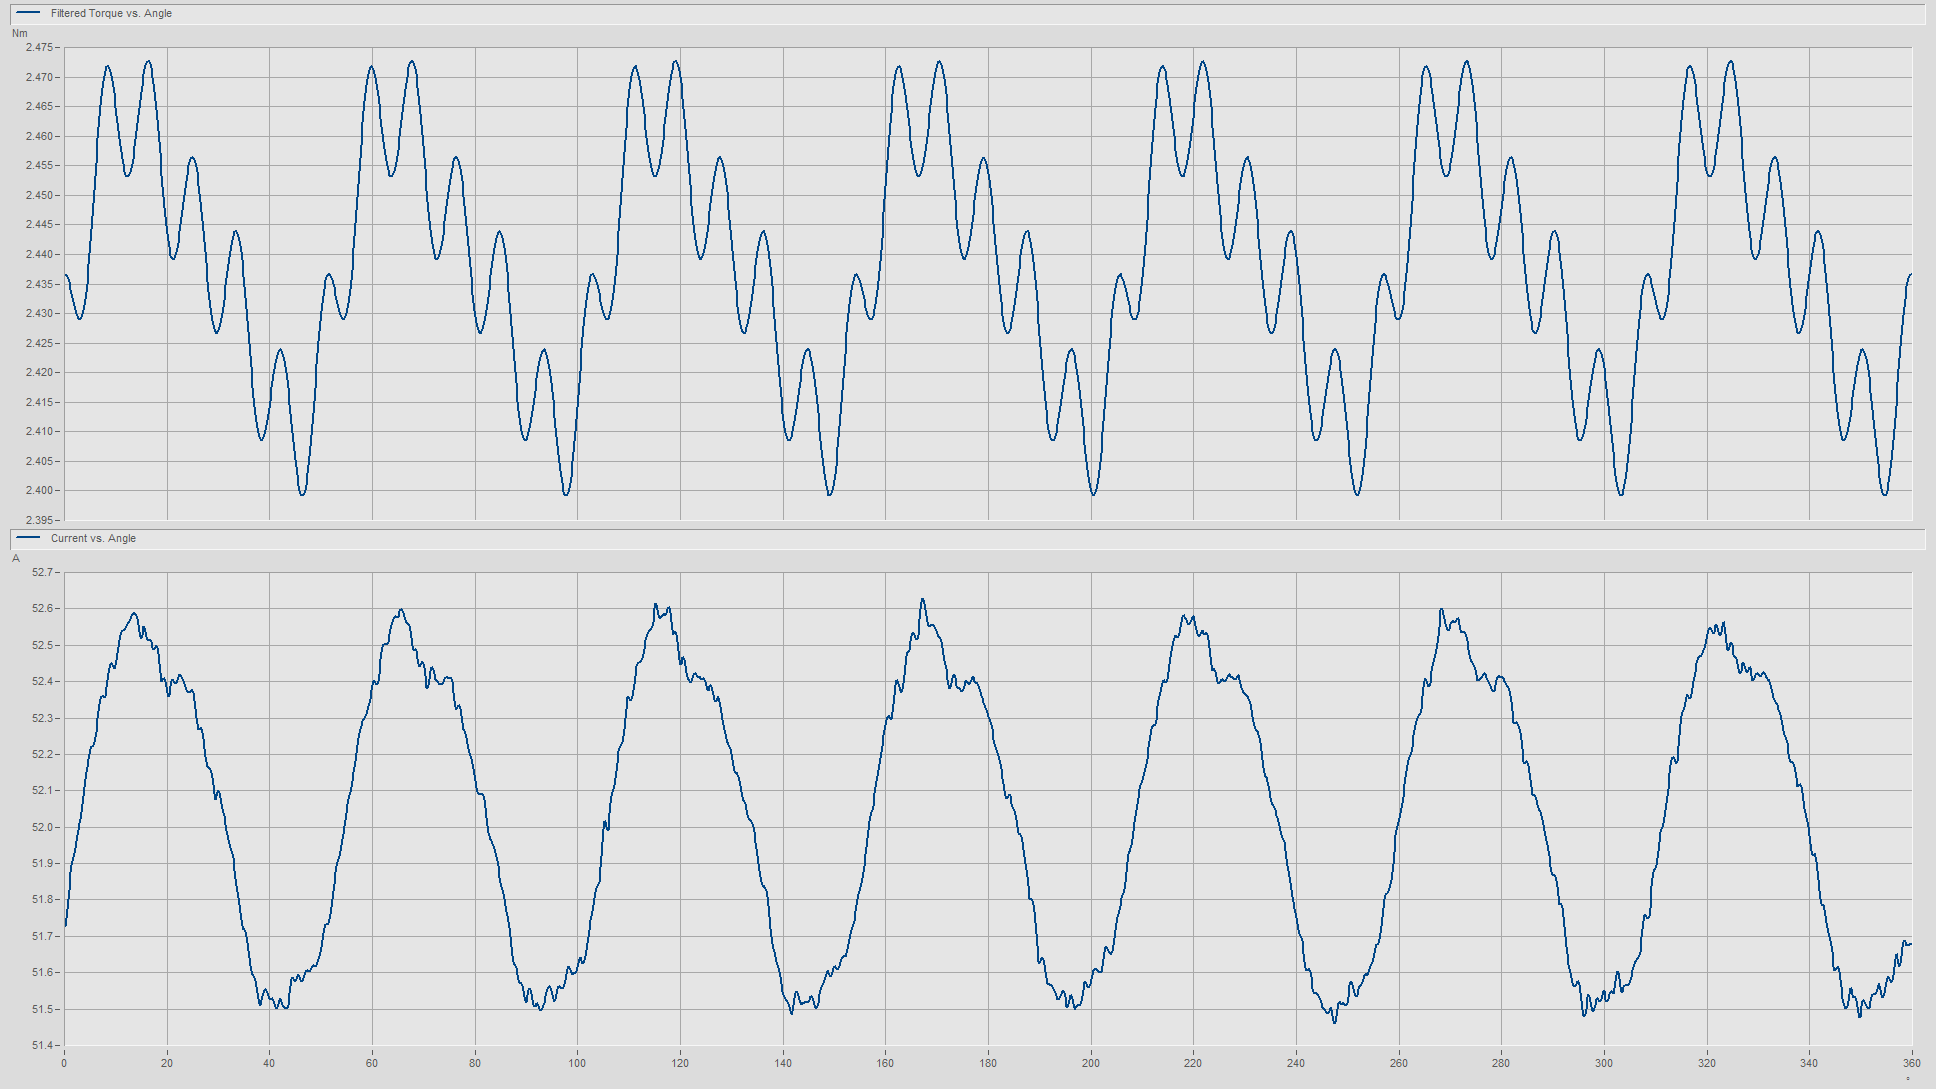
Torque ripple
Due to their electromagnetically asymmetrical design, electric motors have a non-constant torque over the revolution. This torque ripple is a problem in various applications, such as electrically assisted steering systems in the automotive industry.
By measuring the torque ripple at a fixed speed and a specified torque, statements can be made about the behavior of the motor in the target application. The DUT is actively controlled during this test and the test sequence can be individually parameterized.
Description of the test procedure
The test specimen is coupled to the load machine of the test bench using a coupling. After the start of the test, the load machine drags the test specimen to a target speed over a preset time. After settling, the DUT is switched on and a steady-state torque is applied to the shaft. The controller of the DUT then adjusts the shaft torque to the specified value. Data is then acquired by recording the angle of rotation and shaft torque over a specified time. After the time has elapsed, the shaft torque is controlled to zero and the load machine moves the test specimen to a stop.
Results of the test
- Curve of the resulting shaft torque
- Curve of the angle of rotation
- Curve of the torque versus angle of rotation
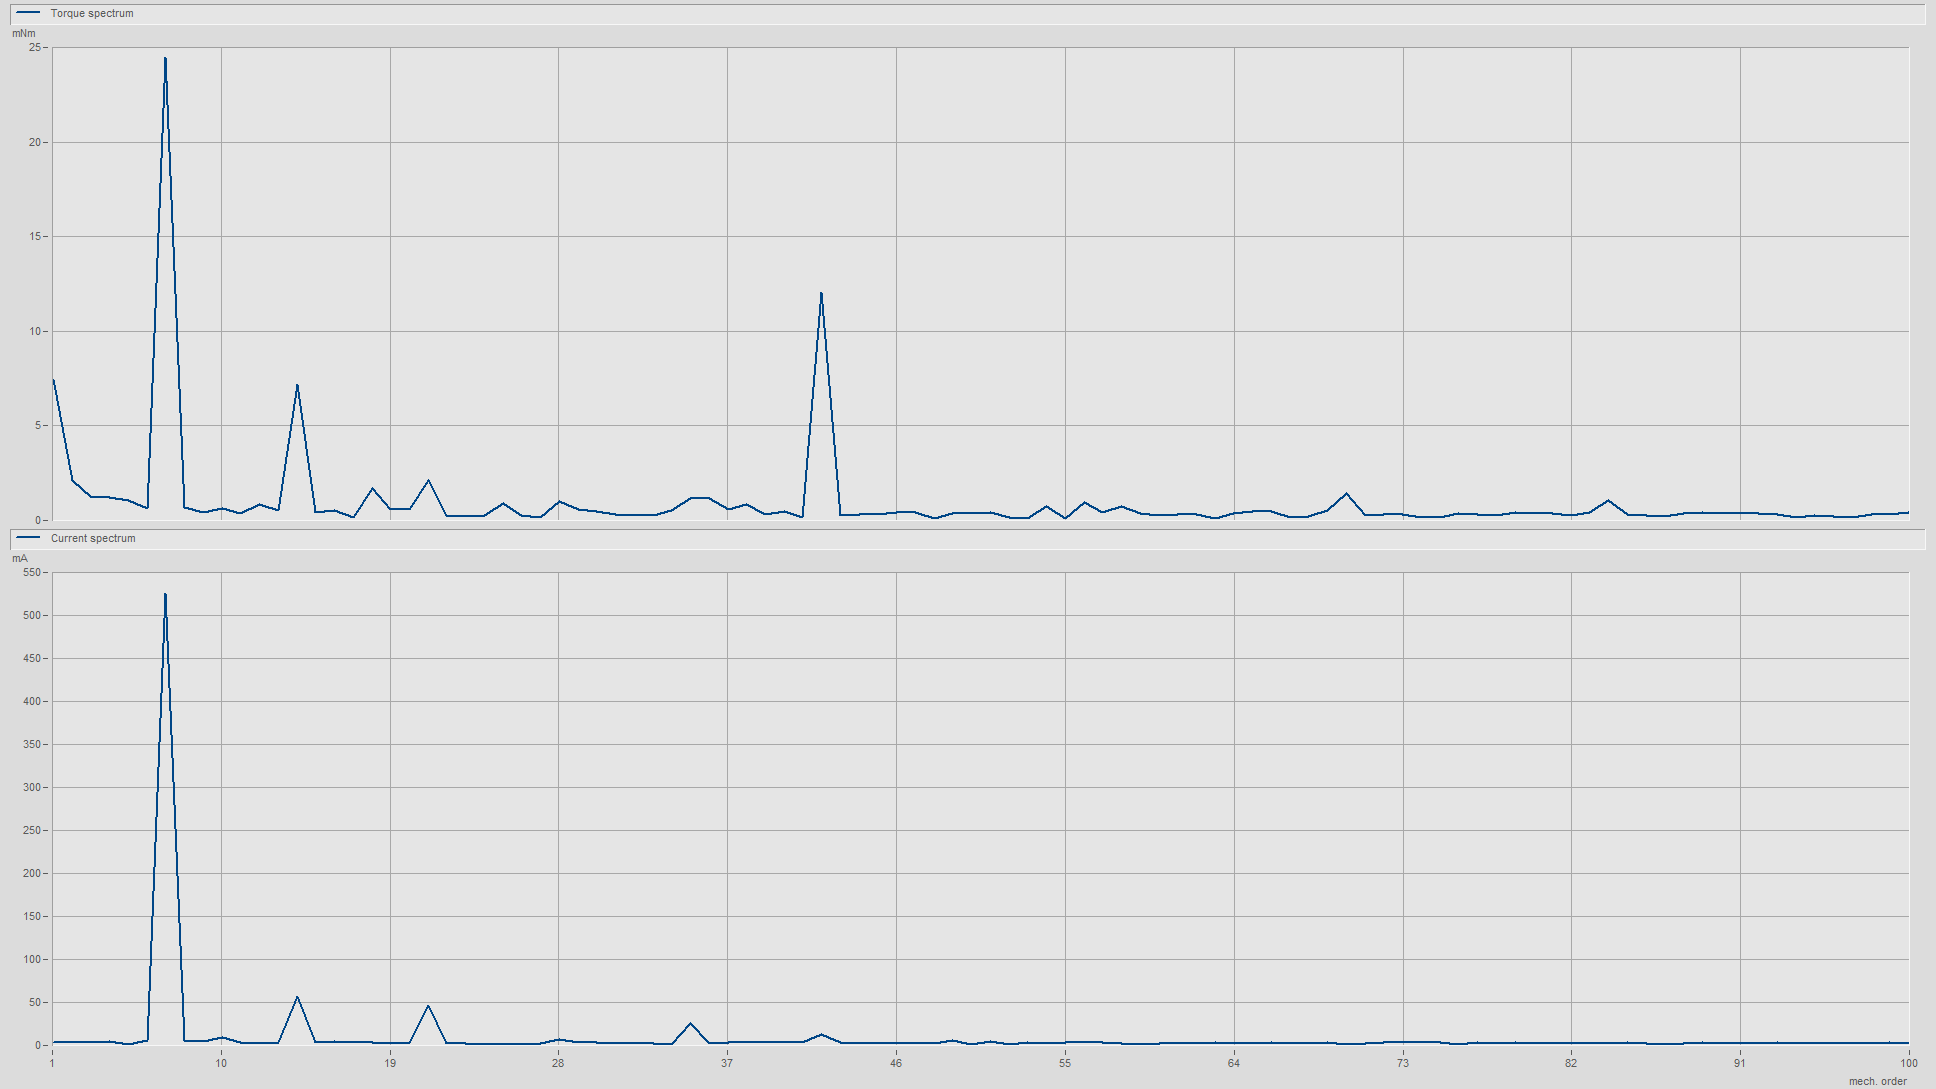
- Order analysis of the shaft torque

Mit dem Laden des Videos akzeptieren Sie die Datenschutzerklärung von YouTube.
Mehr erfahren
Phase resistance
The phase resistance measurement determines resistances of multiphase motors. By comparing the measured resistances, it can be identified if the windings are designed evenly. Deviations from the expected resistance may indicate winding faults, e.g. an incorrect winding number or insulation faults. Finally, the winding temperature can be inferred from the resistance of the winding.
Description of the test procedure (using a 3-phase motor as an example)
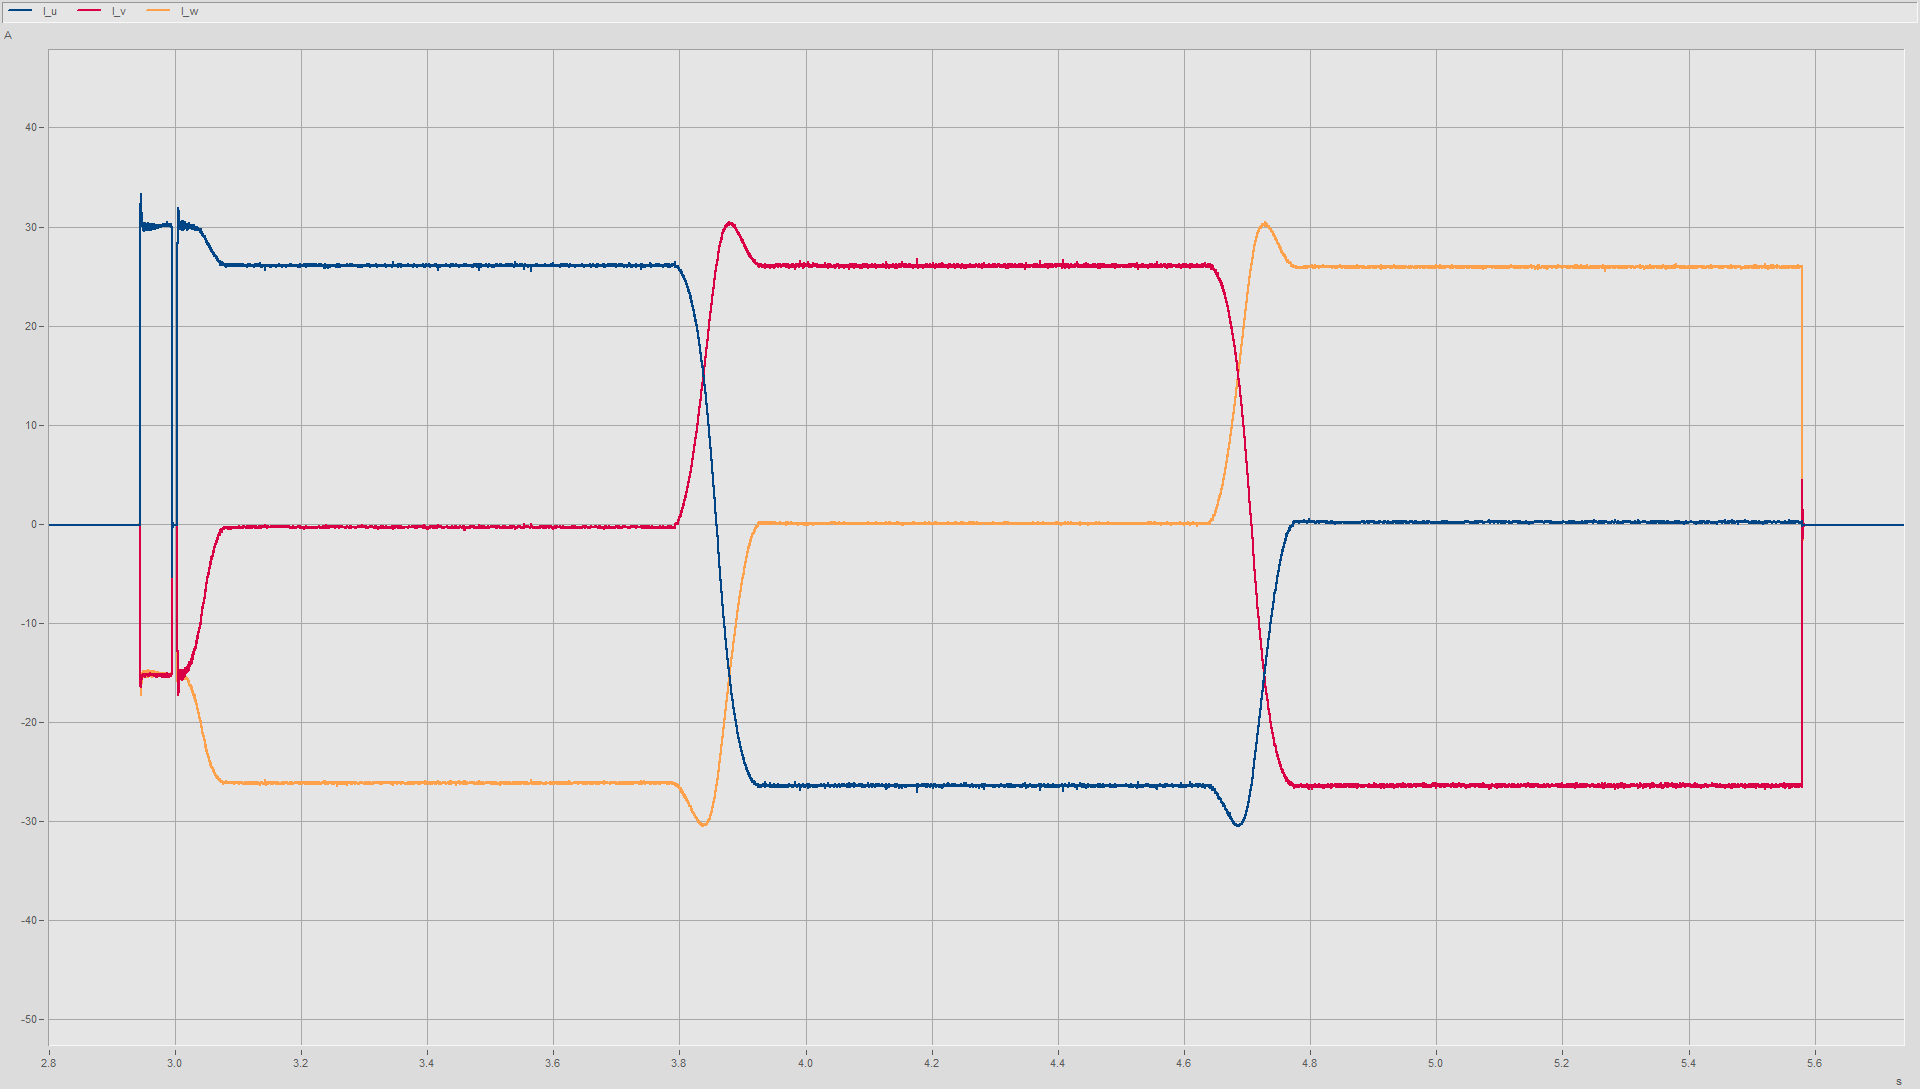
During the phase resistance measurement, a constant measuring current is applied to the DUT in three different configurations in order to determine the three phase resistances independently of each other. The following procedure has proven successful:
- Measuring current from terminal 1 to terminal 2, terminal 3 almost without current
- Measuring current from terminal 2 to terminal 3, terminal 1 almost without current
- Measuring current from terminal 3 to terminal 1, terminal 2 almost without current
Results of the test
- Phase resistances of the motor windings
- Phase resistances of the motor windings scaled to 20 °C
- Average phase resistance
- Phase resistance variation
- Terminal resistances of the motor
- Terminal resistances of the motor scaled to 20 °C
- Average terminal resistance
- Scattering of the terminal resistances

Mit dem Laden des Videos akzeptieren Sie die Datenschutzerklärung von YouTube.
Mehr erfahren
Inductance
The inductance measurement is used to measure the winding inductance of a motor. Here, the change in inductance is measured via
one mechanical revolution and thus the dependence on the rotor position is recorded.
Description of the test procedure
First, a DC current is applied across two terminals of the DUT to measure the terminal resistance of the motor. A sinusoidal AC current is then applied across the same two terminals and the DUT is slowly rotated by the load machine so that the terminal inductance can be recorded over the angle of rotation. At the end of the test, the terminal resistance is measured again.
Results of the test
- Inductance over one mechanical revolution of the motor
- Line-to-line inductance
- Phase inductance

Mit dem Laden des Videos akzeptieren Sie die Datenschutzerklärung von YouTube.
Mehr erfahren
Flux table EC static
The static flux table measurement for EC motors determines the magnetic flux in the d and q directions as a function of the applied total current. For this purpose, the DUT is tested at static load points. In addition, the resistive losses as well as the friction and iron losses of the test specimen are determined.
The information obtained can be used to calculate optimum control of the motor as a function of the speed. That is, for any given speed, as well as current and voltage limits, the total current and current angle can be calculated that meet a given torque requirement with minimum current rms value. This automatically minimizes ohmic losses and maximizes the efficiency of the entire drive system.
Description of the test procedure
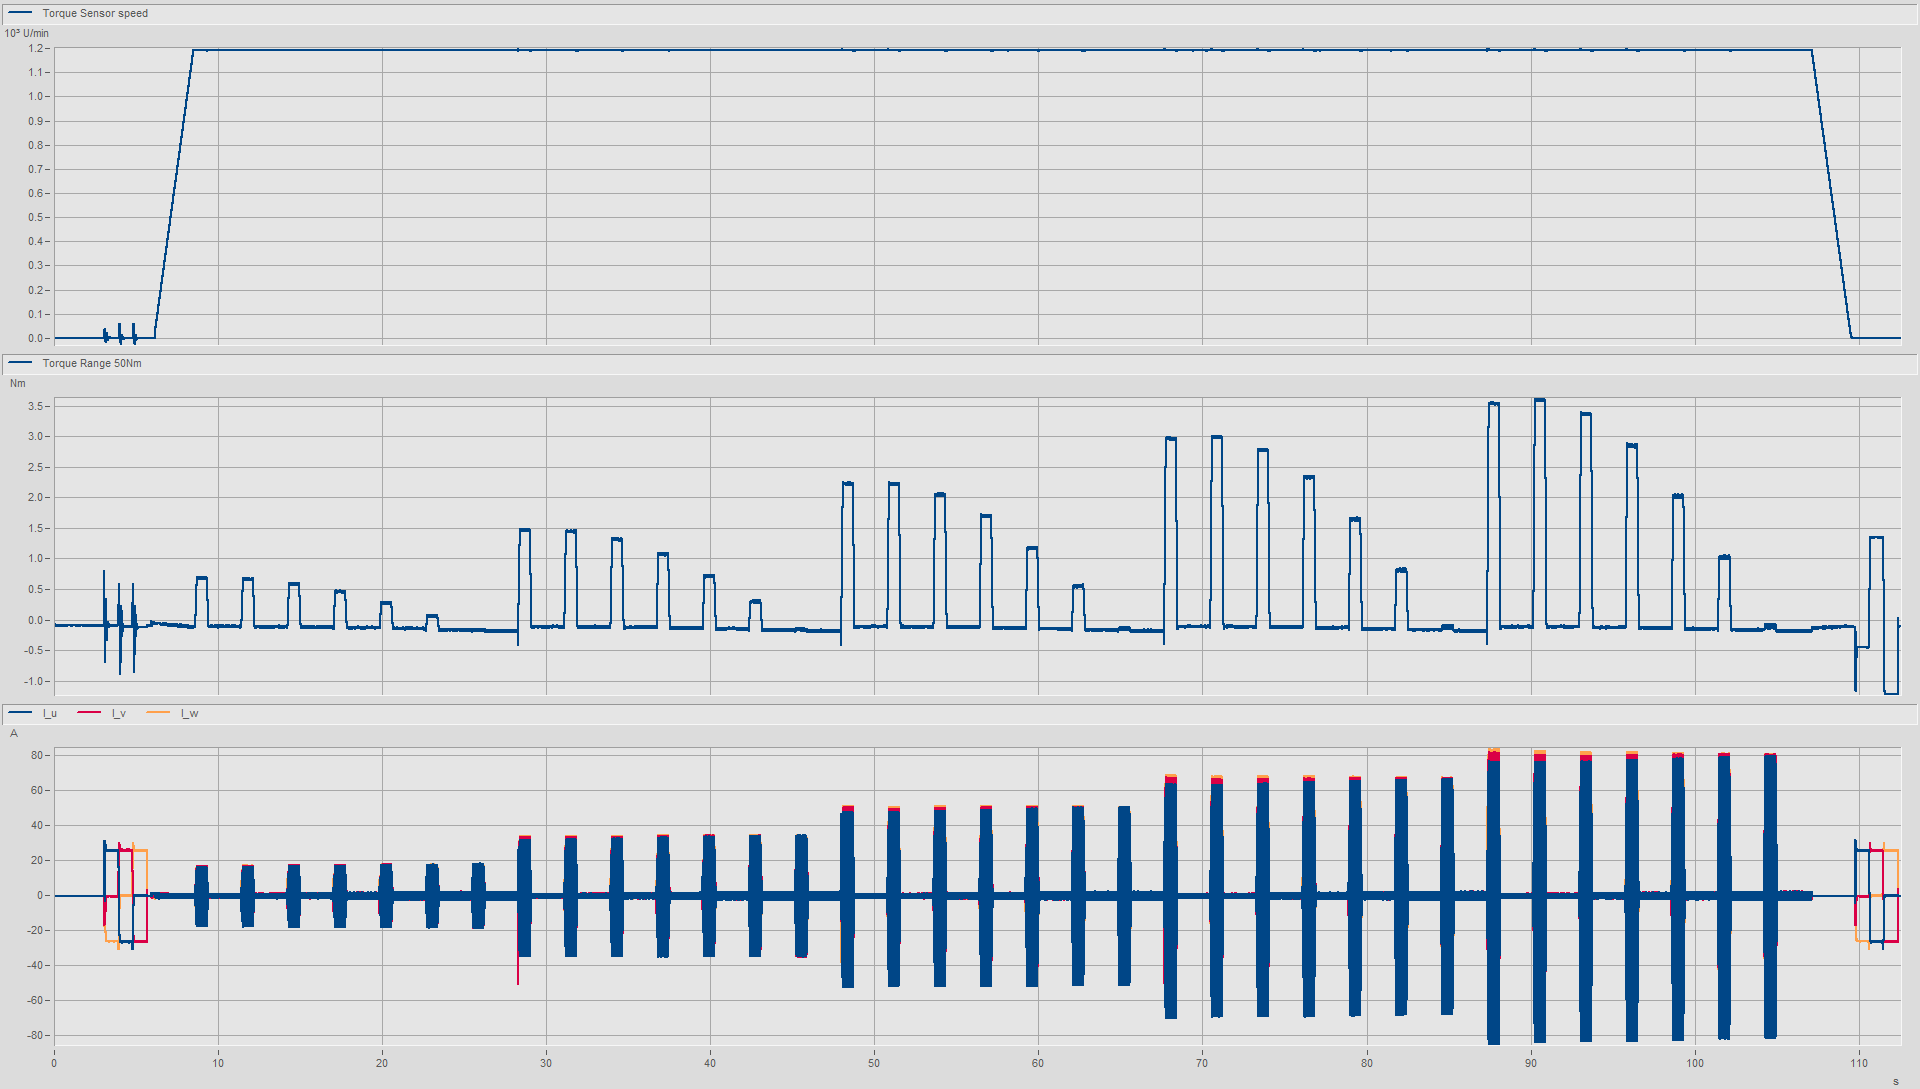
For static flux table measurement, the DUT is connected to a controller. At the beginning of the test, the winding resistances of the DUT are determined in a DC current test. The DUT is then dragged by the load machine to the test speed. Here, the frictional torque of the DUT is measured as a function of the rotational speed. Now the DUT is supplied with current at several operating points. In this process, the amount of (total) current is increased step by step. For each individual current step, the current angle is also varied step by step. There are adjustable cooling pauses between the individual operating points.
At the end of the test, the frictional torque is measured again in a downward ramp and the winding resistances are determined in a DC test. This measurement data is used both to compensate for the influence of the inertia in the speed ramps and to record the heating of the windings during the test.
Results of the test
- Magnetic flux in d-direction as a function of d- and q-current
- Magnetic flux in q-direction as a function of d- and q-current
- Internal electrical torque
- Maximum torque for the given current and voltage limits as a function of speed
- d-current as a function of speed to generate the optimum torque characteristic curve
- q-current as a function of speed to generate the optimum torque characteristic curve
- d-current as a function of speed and torque for the minimum total current at the operating point
- q-current as a function of speed and torque for the minimum total current at the operating point
- Total current as a function of speed and torque at minimum total current at operating point
- Electrically absorbed power as a function of speed and torque at minimum total current at the operating point
- Mechanical power output as a function of speed and torque at minimum total current at operating point
- Efficiency as a function of speed and torque with minimum total current at the operating point
- Ohmic losses as a function of speed and torque with minimum total current at the operating point
- Friction losses as a function of speed and torque
- Total losses as a function of speed and torque with minimum total current at the operating point

Mit dem Laden des Videos akzeptieren Sie die Datenschutzerklärung von YouTube.
Mehr erfahren
Custom tests
We develop test types and evaluations according to your specifications. The test types are either based on our standards and are customised with additional steps and calculations or are created from scratch according to specific requirements and needs.
Unlike our standard test types, which are developed for a wide range of users, our customised solutions allow for individual test sequences and evaluation processes. External hardware, interfaces or third-party devices can be easily integrated on request. With a fully integrated solution, efficiency and productivity can be increased and a seamless user experience can be ensured. Later, the test types developed specifically for the user can be flexibly adapted to meet new requirements.
Customised software is developed in close collaboration between our development team and the customer. We are happy to use iterative development processes to continuously integrate the customer’s feedback and create a solution that brings together expectations and expertise.

